PROJECT: Savvas — ReadingSpot & SuccessMaker
PreK-8 Product App Designs
PreK-8 Product App Designs
ROLE:
Sr. UX / UI Designer at Savvas working on two of their PreK-8 app designs
KEY SKILLS / DELIVERABLES:
• Detailed Annotated Wireframes
• UX / UI Design
• Illustration
• PreK-8 Education Product App Design
• Adaptive Learning Product Design
• Visual Design System
• Personalization Concepts
• Content Writing
DESIGN APPS USED:
• Sketch (detailed UX / UI Designs)
• Invision (interactive prototyping)
• Adobe Illustrator
PROJECT OVERVIEW / CONTEXT:
Savvas — formerly known as Pearson K-12 Learning — is the K-12 unit spinoff of its parent company in 2020. Pearson is among the top three giants in the educational publishing sector that includes McGraw-Hill Education and Houghton Mifflin Harcourt.
Created wireframes, illustrations, and detailed UI visuals for ReadingSpot and SuccessMaker apps in Sketch. Presented the work in Invision for UX design team and product managers' feedback and annotated designs to coordinate feature discussions with developers. Collaborated with creative team on defining unified design standards for Savvas product lines. I worked on the following two educational apps:
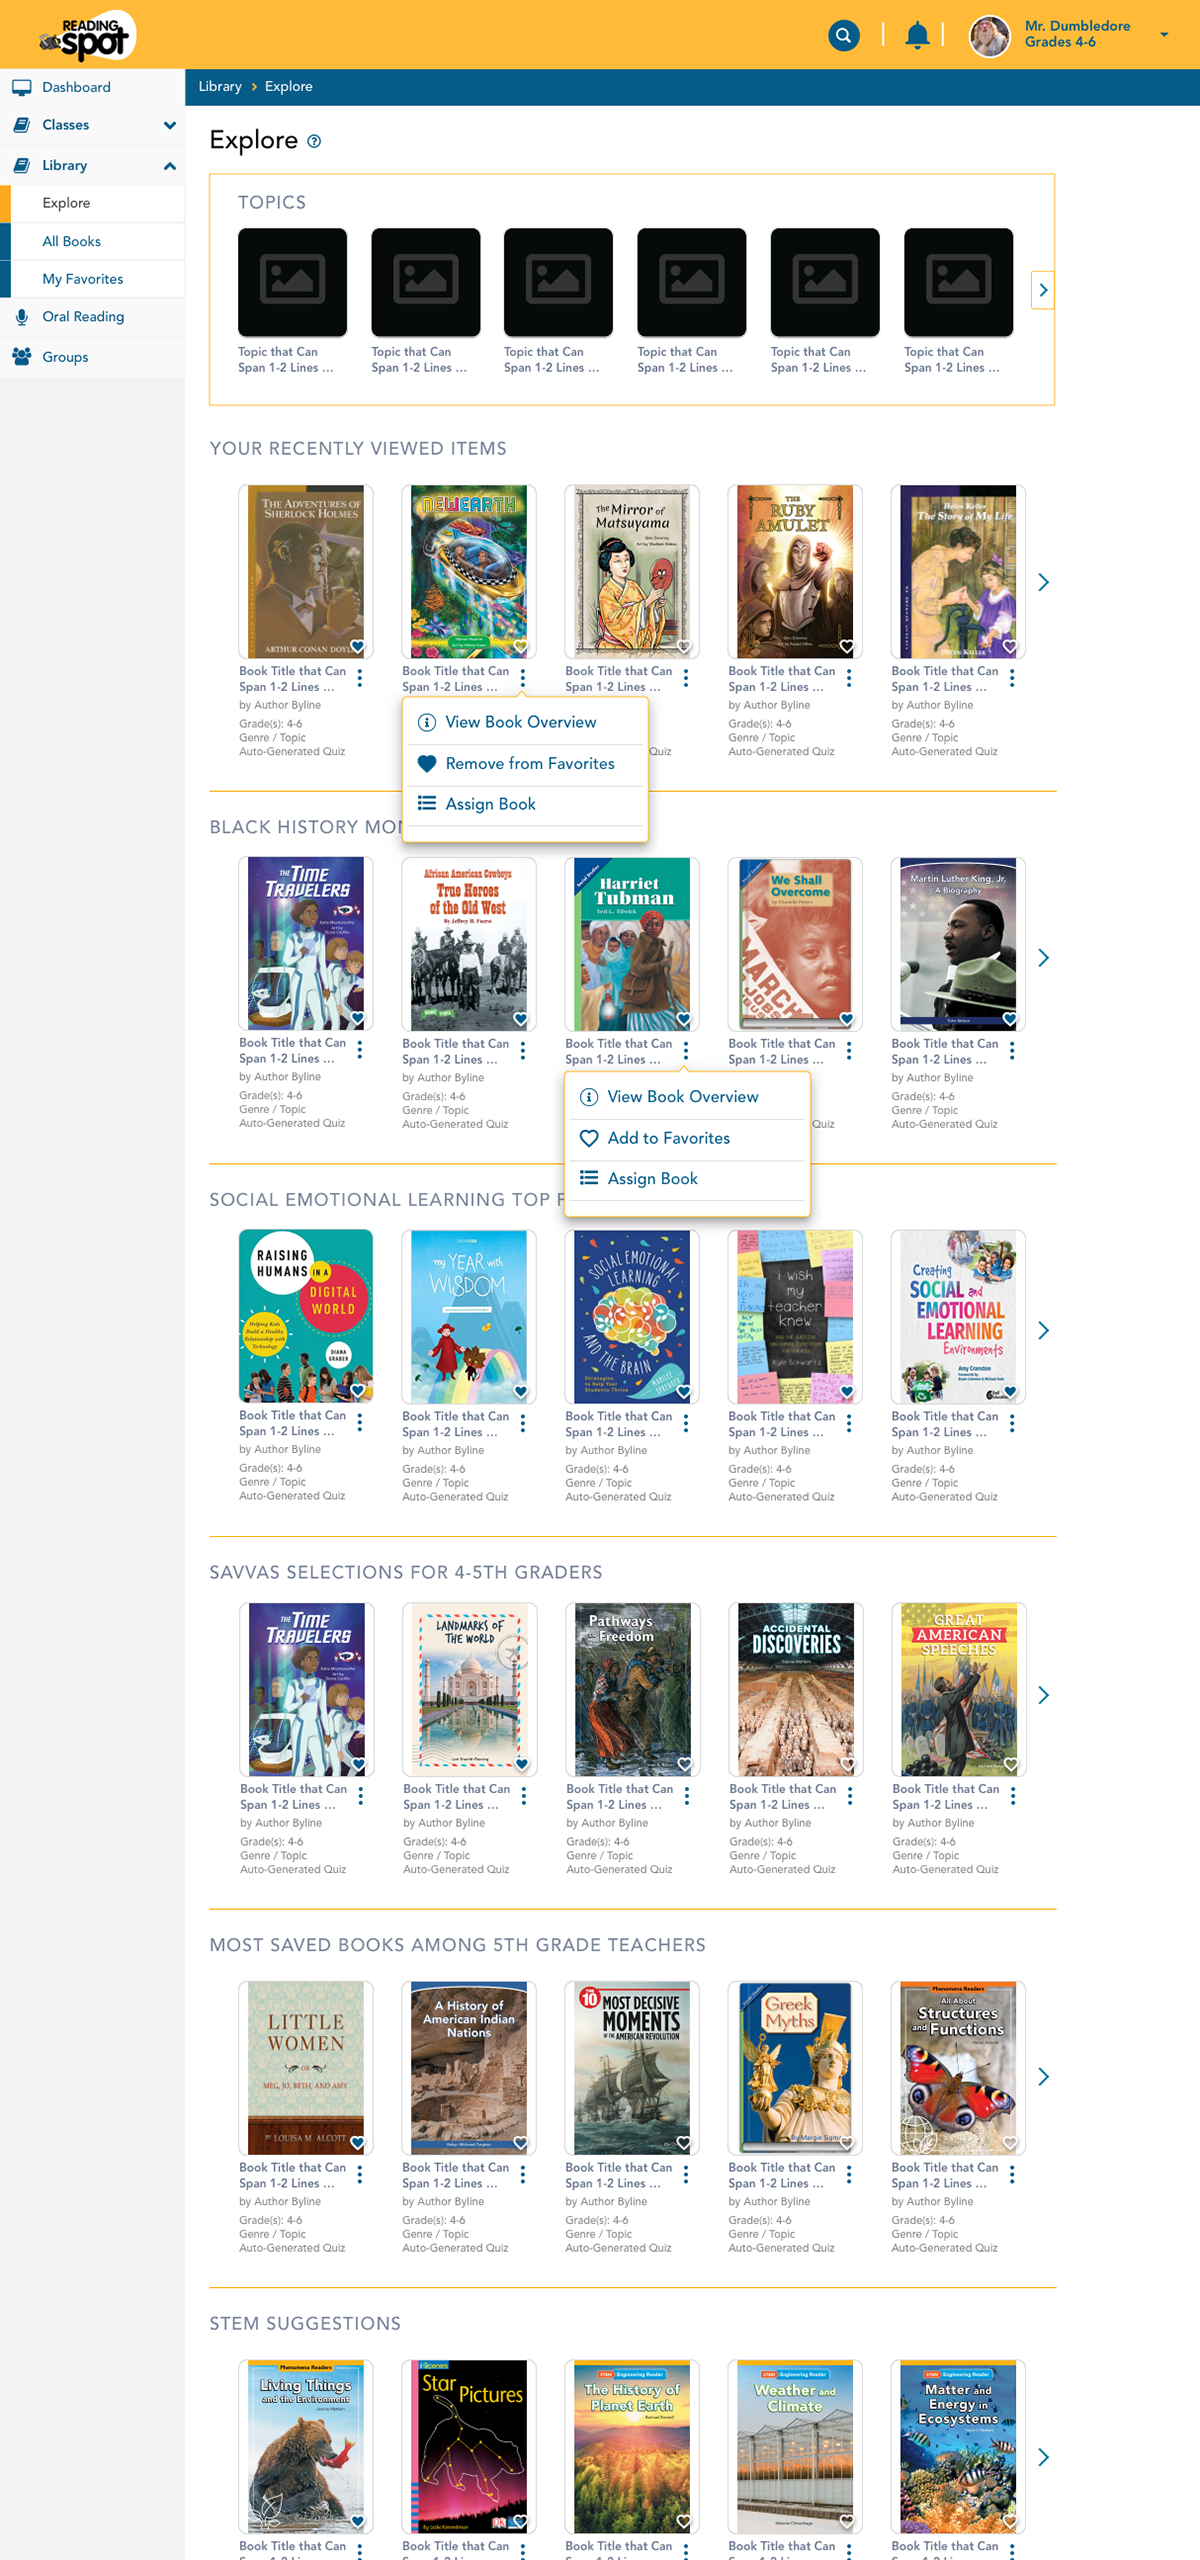
ReadingSpot — a digital library— offers students a curated collection featuring 3,500+ eBooks in a wide range of genres and 600+ Spanish titles from beginners to 1200+ lexile reading levels. ReadingSpot empowers teachers to assign books to PreK-6 kids and for the students to bookmark their favorite books to read and work on assignments. It also features audio narration, highlighting, note taking, reporting, and teacher support.
ReadingSpot — a digital library— offers students a curated collection featuring 3,500+ eBooks in a wide range of genres and 600+ Spanish titles from beginners to 1200+ lexile reading levels. ReadingSpot empowers teachers to assign books to PreK-6 kids and for the students to bookmark their favorite books to read and work on assignments. It also features audio narration, highlighting, note taking, reporting, and teacher support.
SuccessMaker is a K-8 math and literacy intervention and supplemental program that launched at Stanford in collaboration with IBM and now has 50+ years of proven results. Their adaptive learning app widely used in schools enables teachers and district admin to assign, personalize, and track individual students' and group performance in math and reading to meet academic standards and requirements. It offers 100,000+ math exercises and 1,640 learning objectives. It’s also CASE-certified for special education. SuccessMaker Reading focuses on 1) phonics, 2) phonemic awareness, concepts of print, 3) vocabulary, 4) grammar, 5) spelling, 6) comprehension, 7) fluency.
PROJECT DETAIL: ReadingSpot PreK-8 Product App Design
Featured below are two versions that I proposed for the look and feel of the ReadingSpot application's user-interfaces.
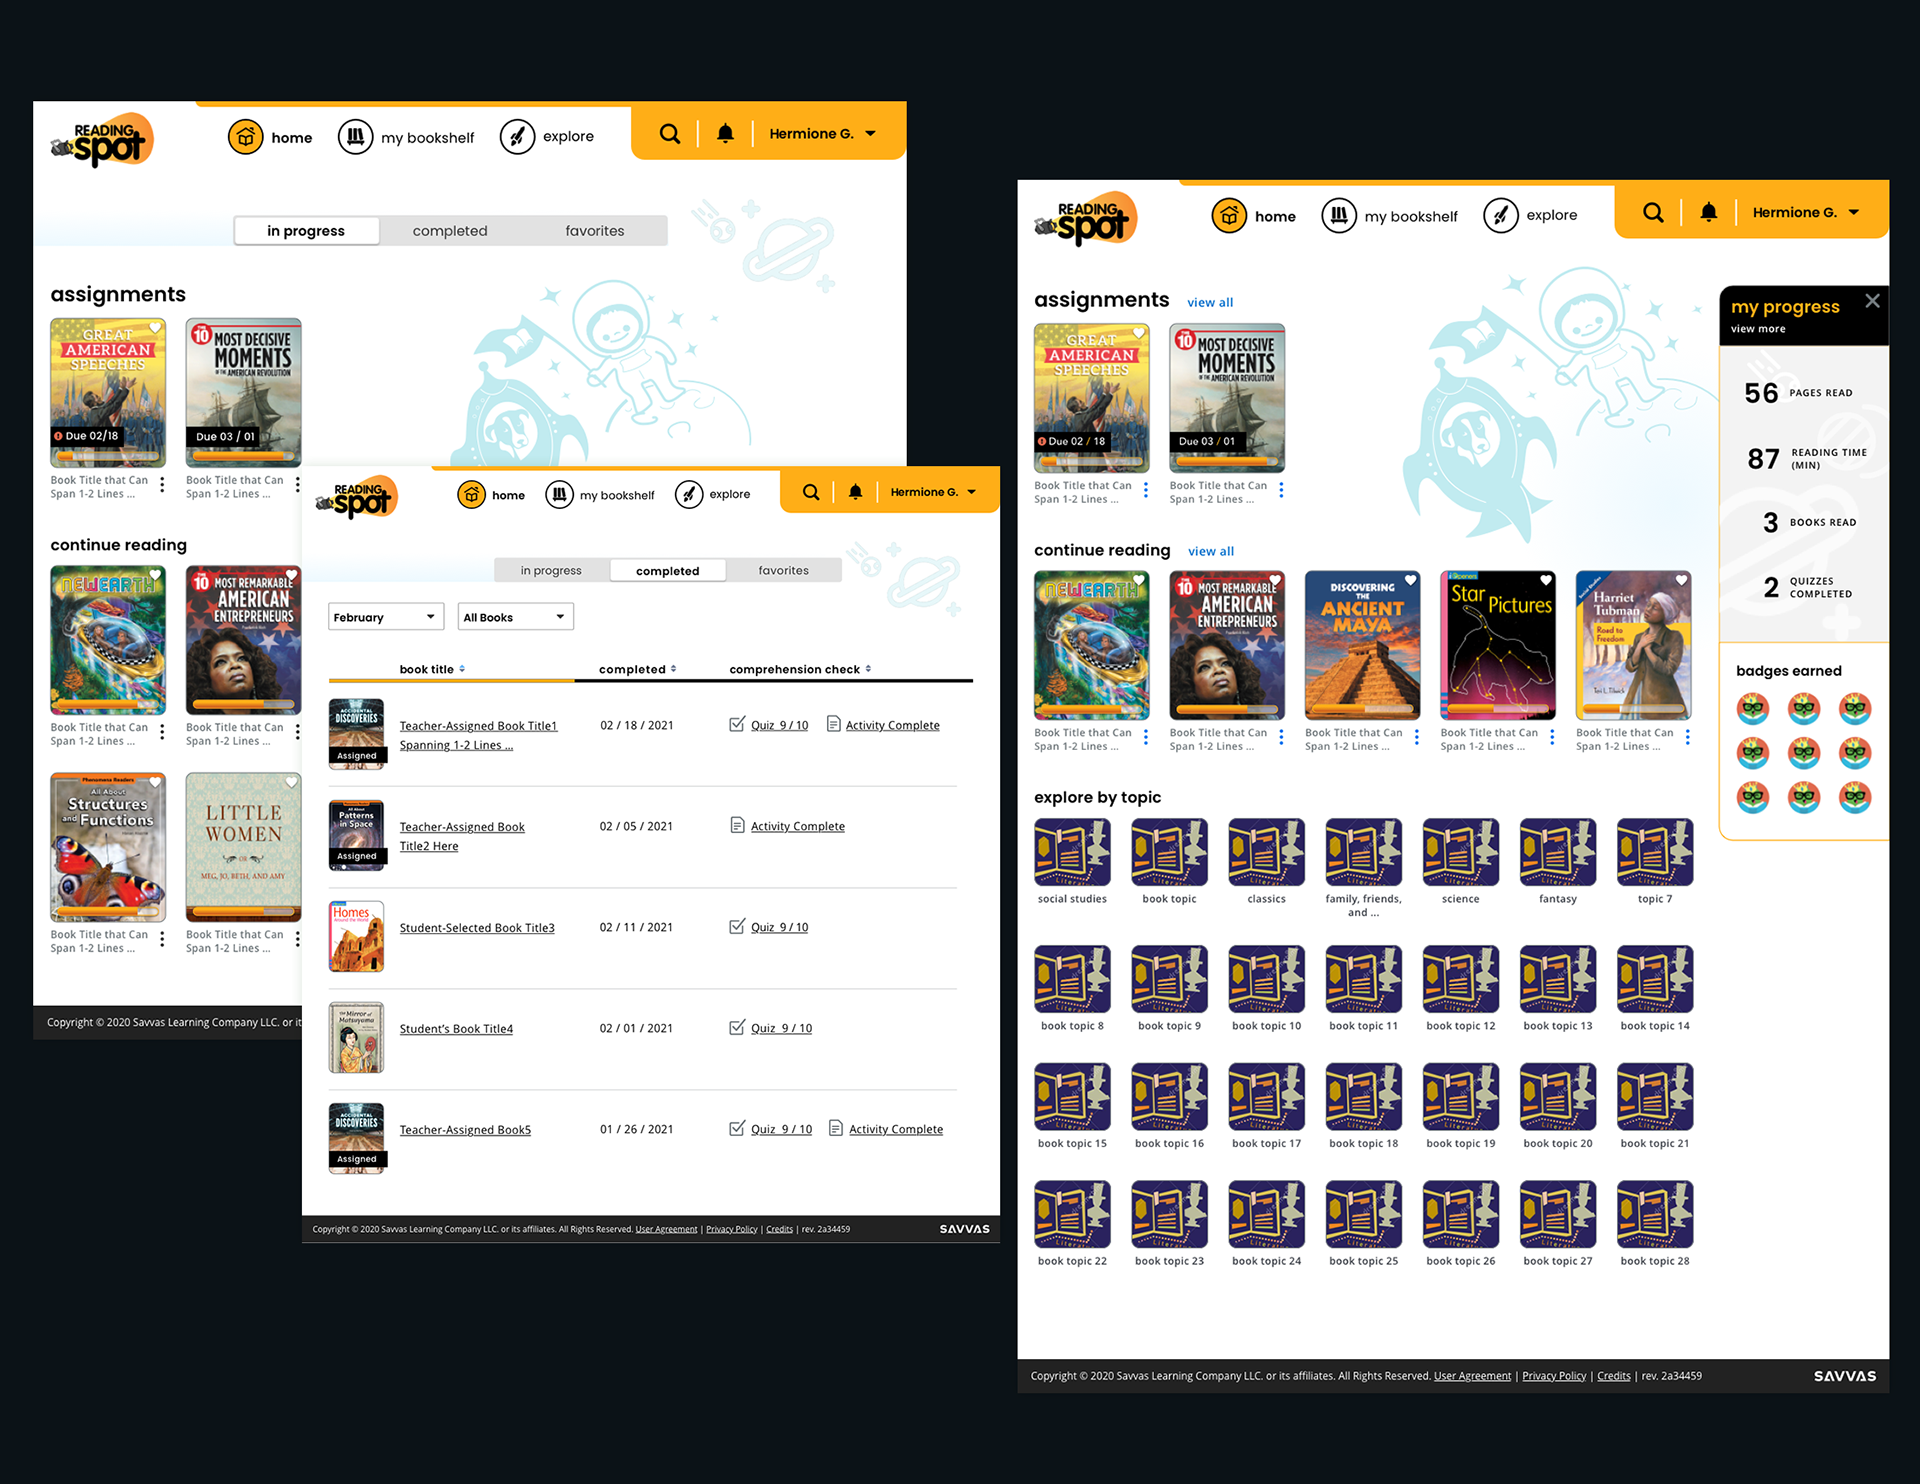
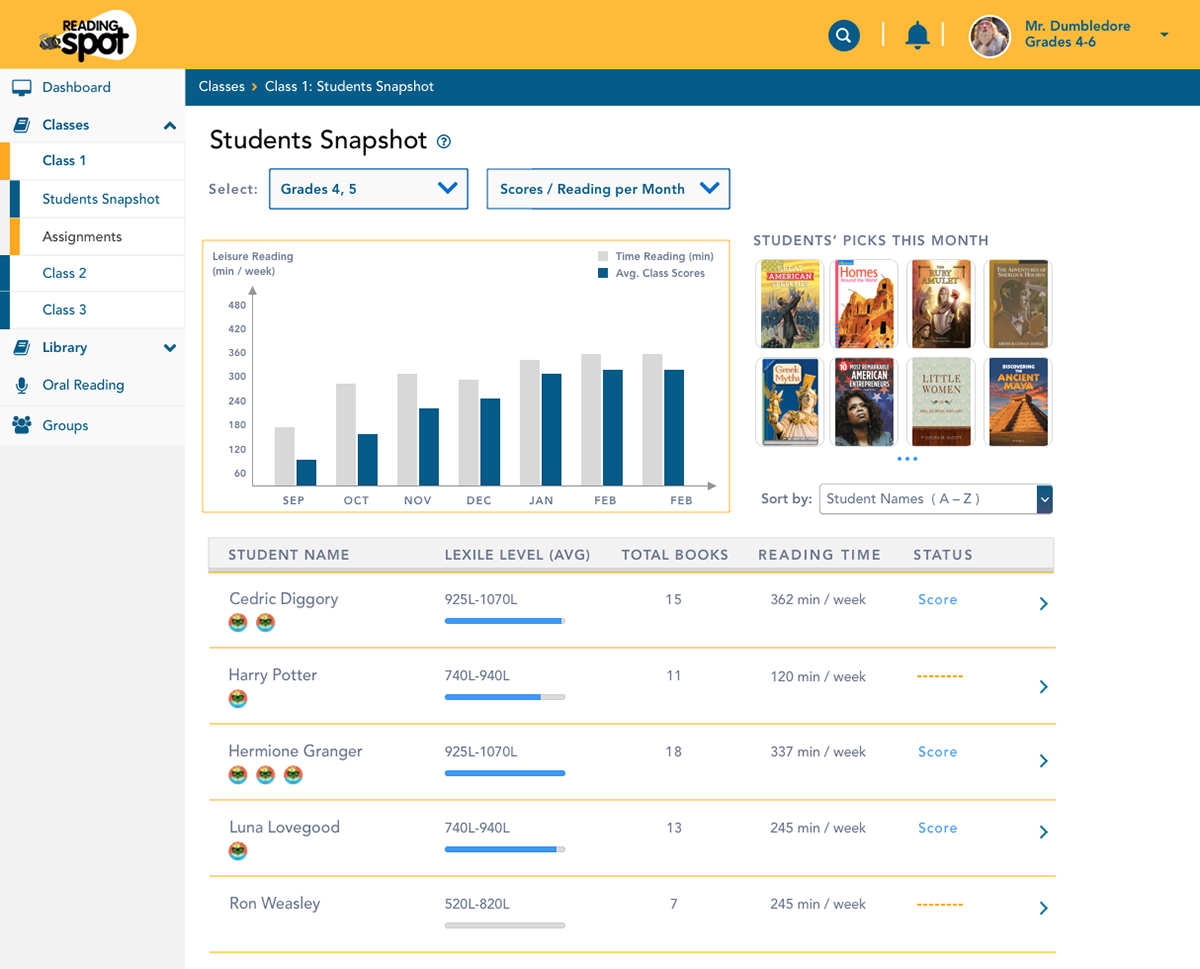
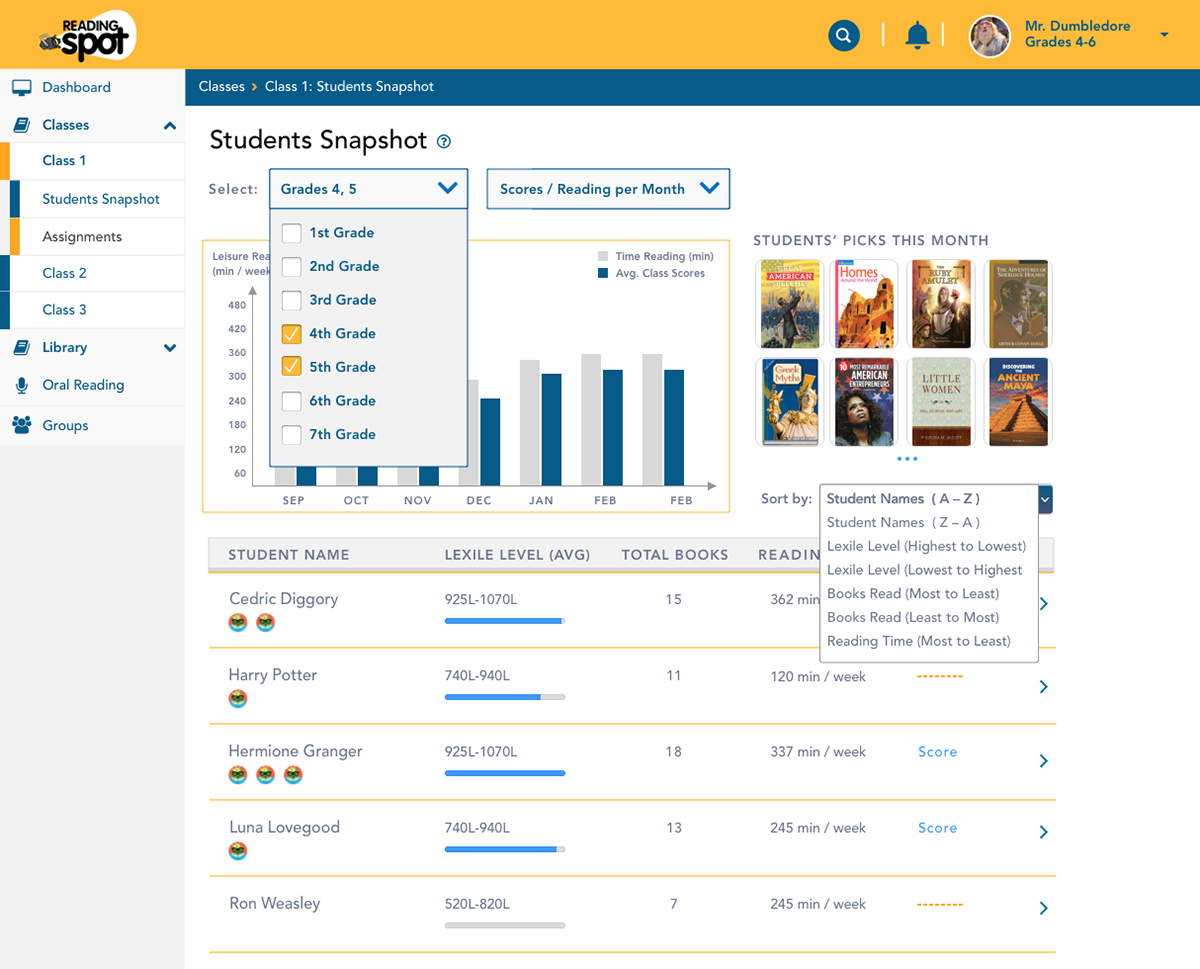
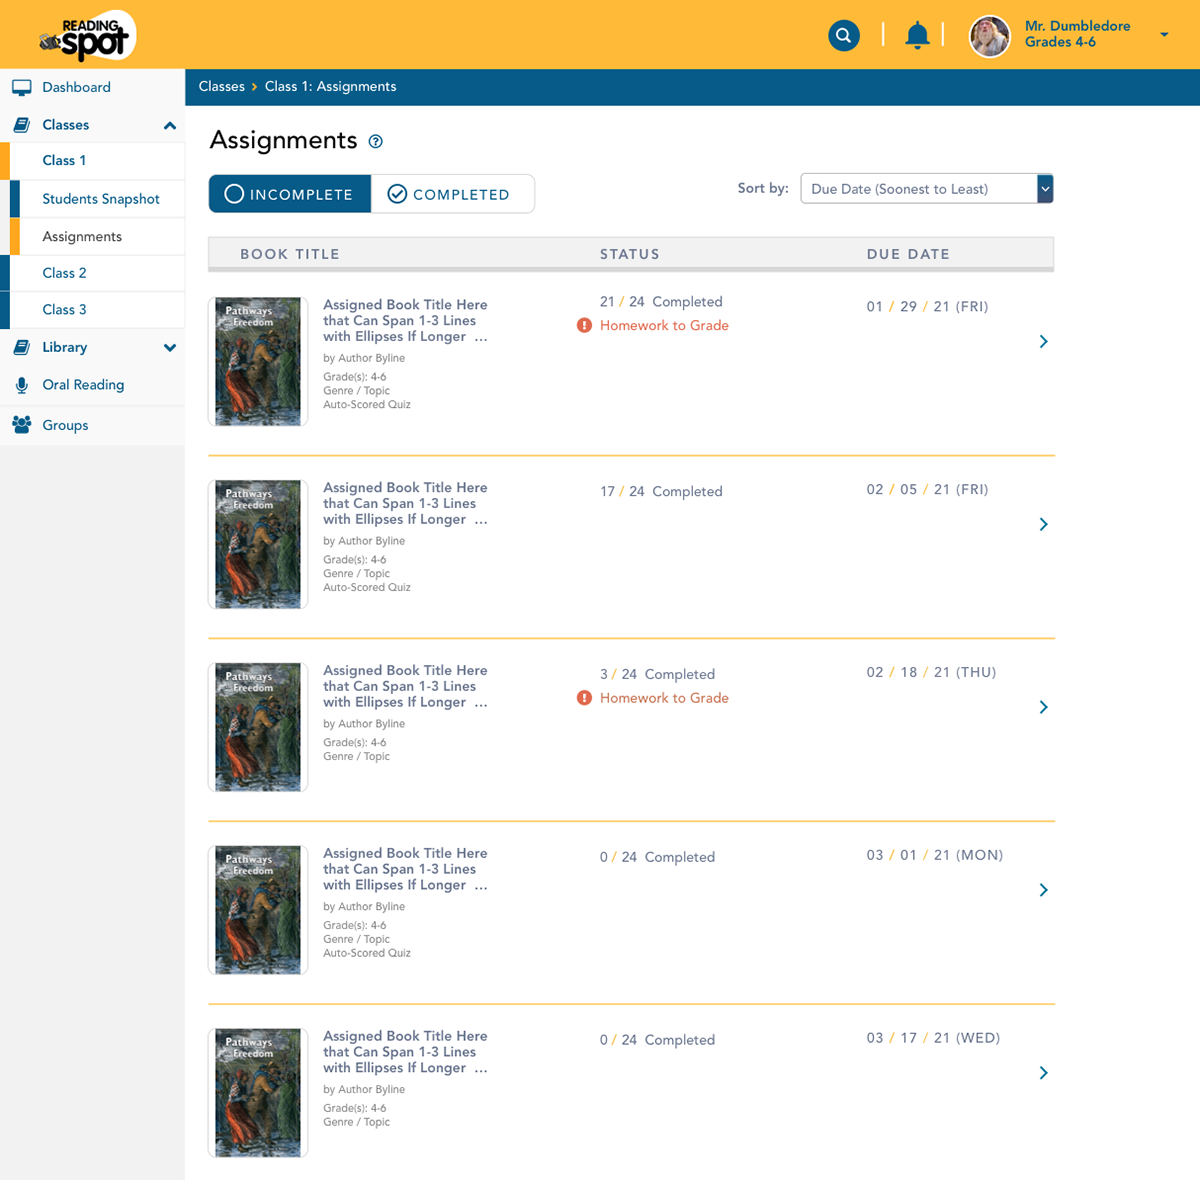
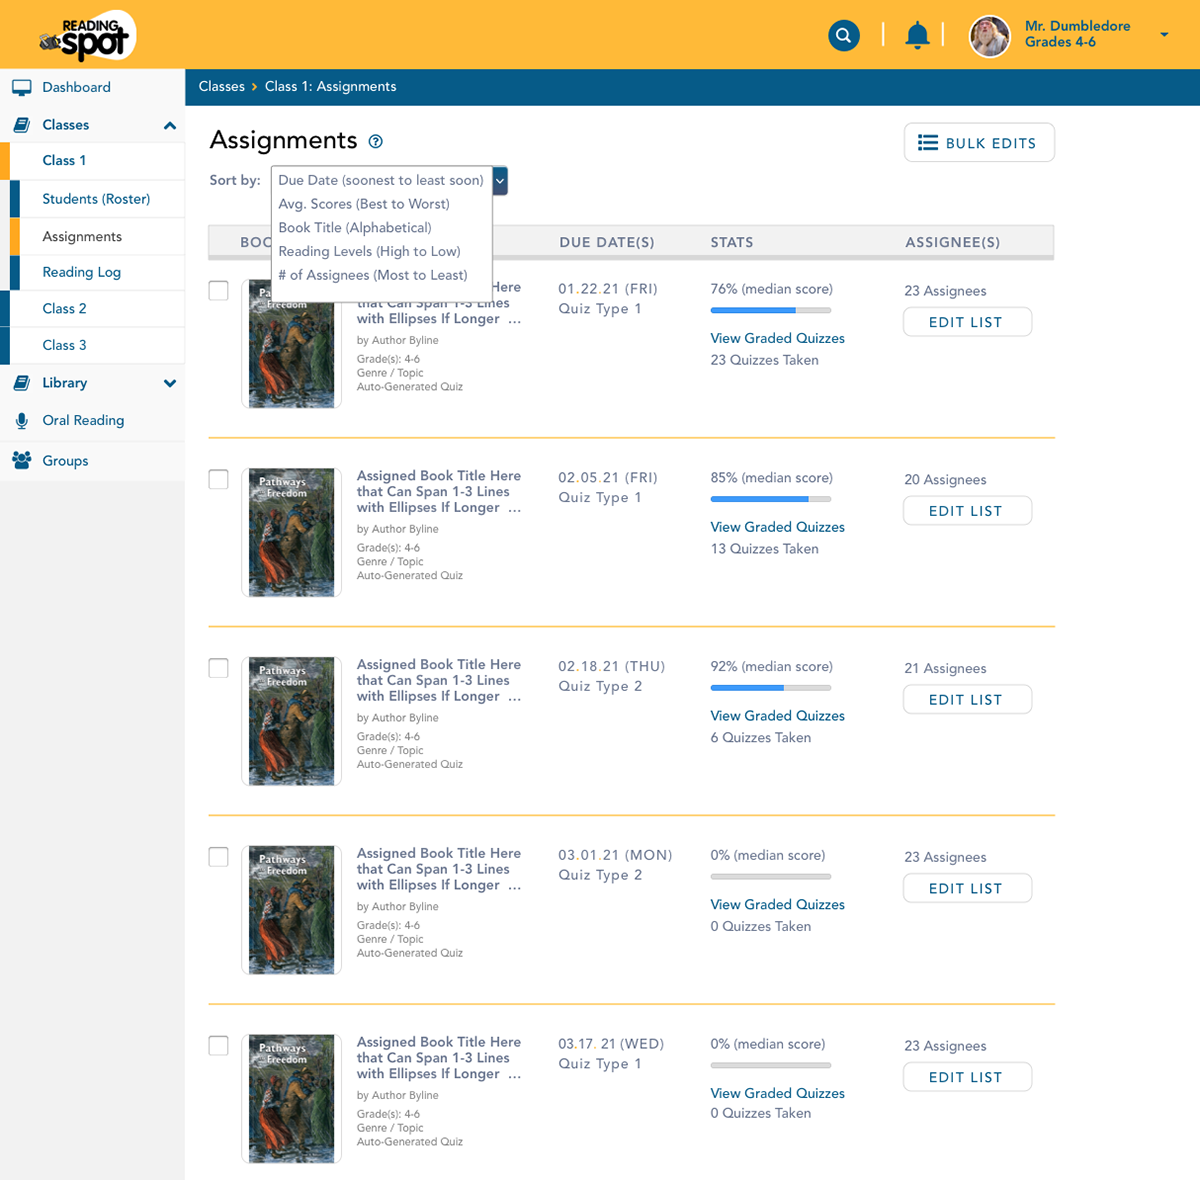
Represented below are my proposed home dashboard design that features a leaderboard displaying am overview on student progress on several key metrics: 1) number of pages they have read; 2) time spent reading; 3) the total number of books, read, and number of quizzes completed. Also featured are screens depicting the drop-down menu designs I proposed for search filtering. Students and teachers can keep track of the number of books completed by a given timeframe and get a status update on whether a book was read and view student performance on quizzes and audiobook reviews. Teachers could potentially distribute automated tests.
Represented below are my proposed home dashboard design that features a leaderboard displaying am overview on student progress on several key metrics: 1) number of pages they have read; 2) time spent reading; 3) the total number of books, read, and number of quizzes completed. Also featured are screens depicting the drop-down menu designs I proposed for search filtering. Students and teachers can keep track of the number of books completed by a given timeframe and get a status update on whether a book was read and view student performance on quizzes and audiobook reviews. Teachers could potentially distribute automated tests.
I custom-drew the illustrations of a robotic child astronaut with his dog Pupster as his sidekick in a space travel theme I proposed to encourage children to view learning as a journey to expand their knowledge, insights, and imagination that I thought was analogous to the enigmas of space travels. The illustration of Pupster for this ReadingSpot app is based on Leo, my fur-baby inspiration. I was tasked with making the app more fun so I thought these little thematic touches with different animal friends accompanying Leo as the primary mascot to follow on various sections of the app would be appealing to children using ReadingSpot.
ReadingSpot UI Visual Redesign — Version 1:
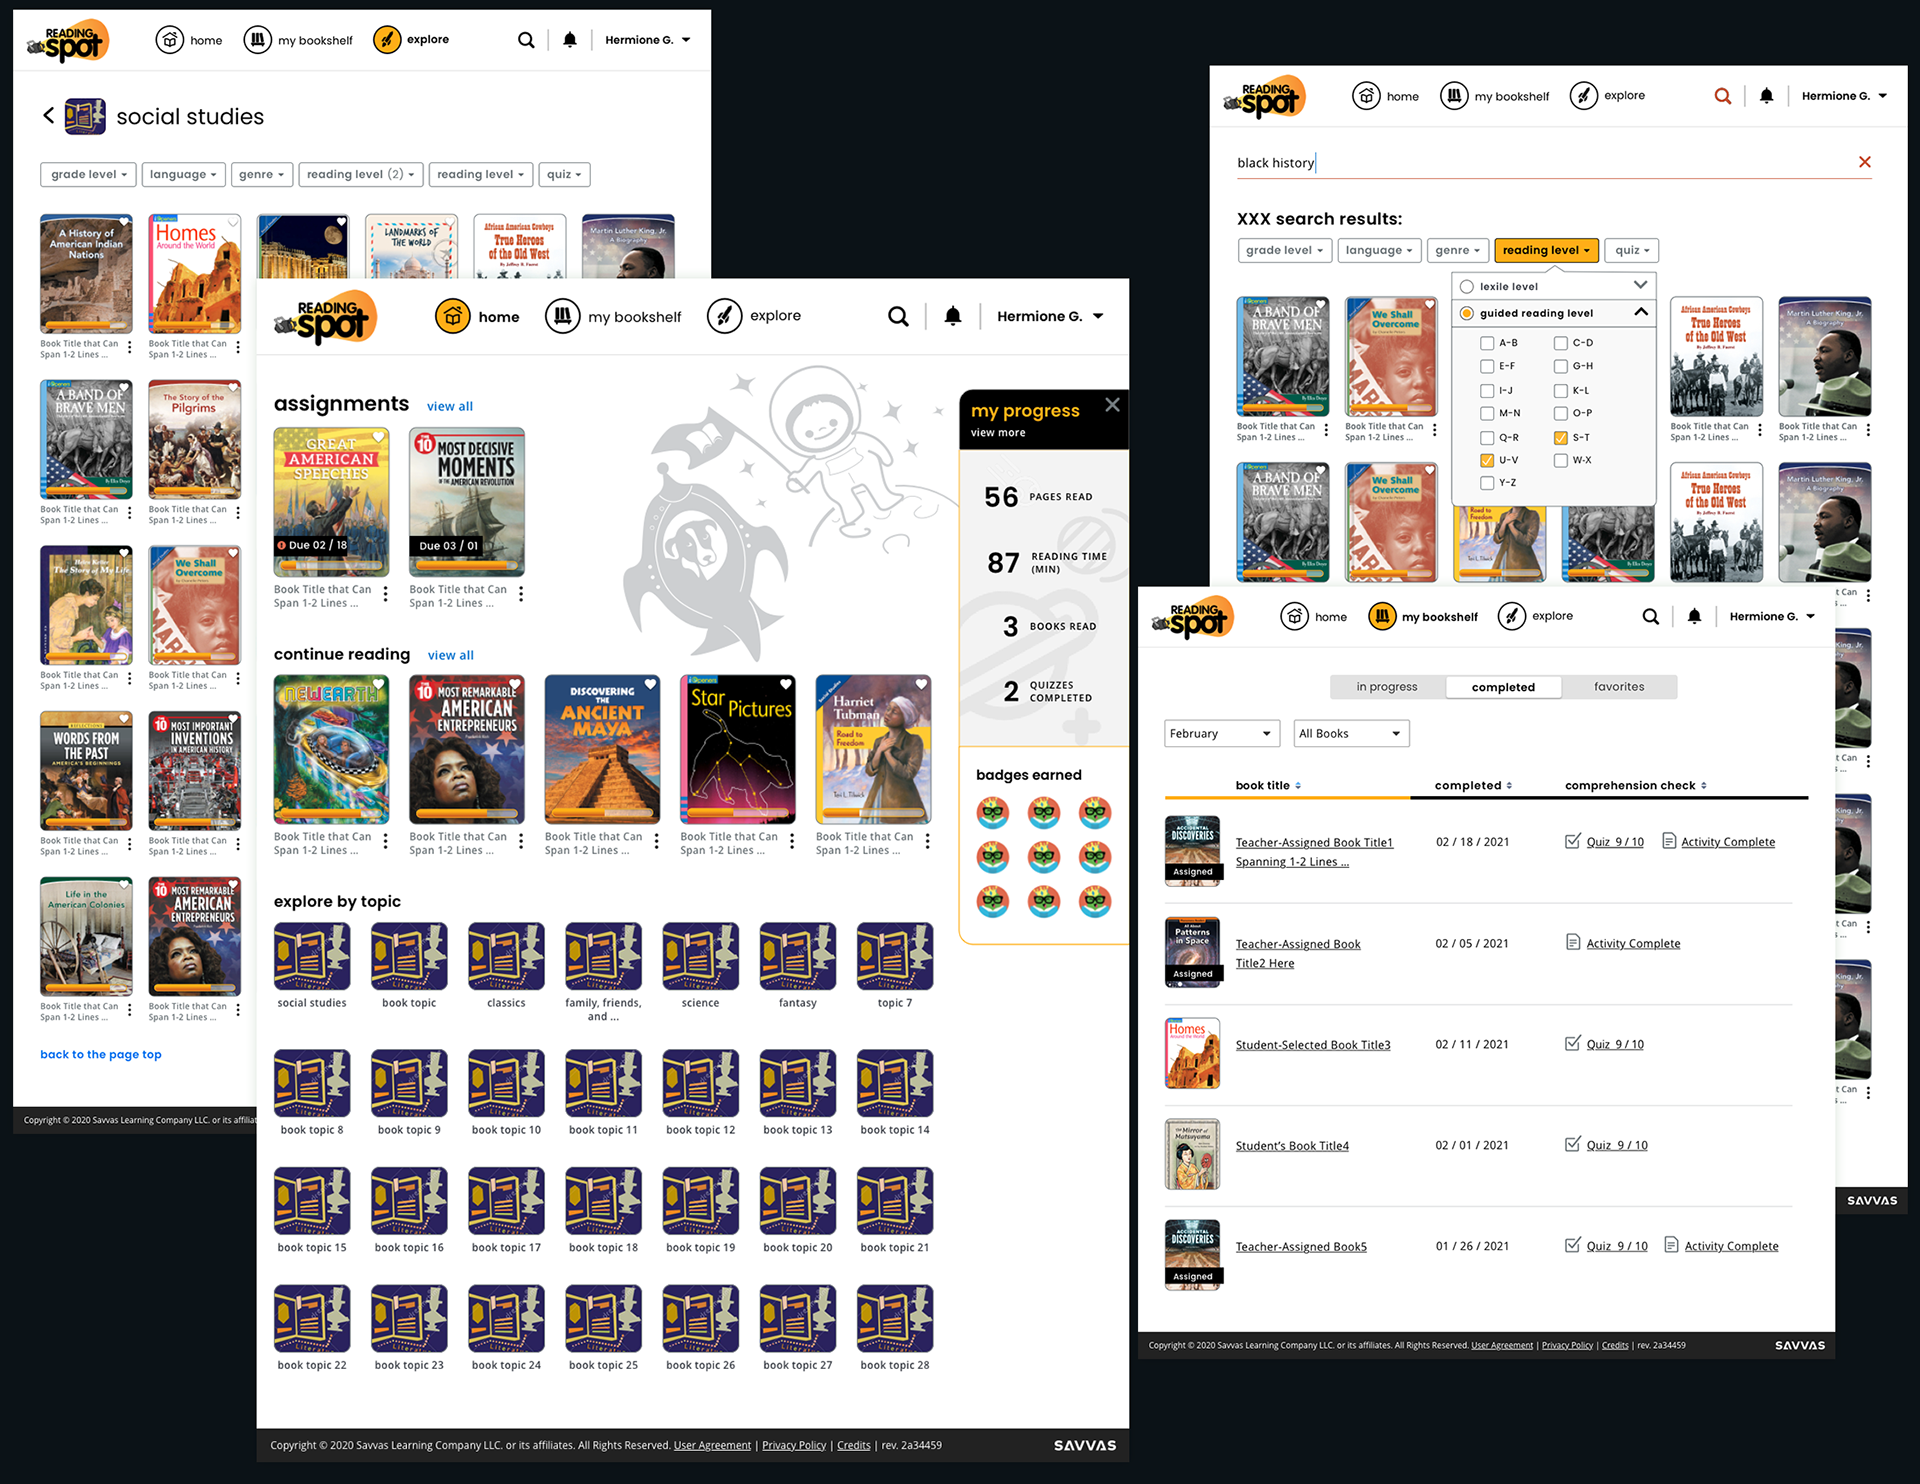
ReadingSpot UI Visual Redesign — Version 2:
Dashboard Designs
Detailed below are sample initial wireframe explorations I proposed with global navigation as it appears currently for the most part. These screens are examples of high-level dashboard functionality I envisioned we could offer to offer more context on student performance and provide insight into students' individual interests based on their self-selected genres to boost their enthusiasm for reading and also recommend alternate genres. I proposed new book genres divided by fiction and non-fiction in the filter bars.
Teacher's Dashboard Ideations
Featured directly below are two concepts for the Teachers' dashboard with my proposed data analytics snapshots for our consideration on which UX direction to take:
Teachers' Dashboard
Version 1:
Version 1:
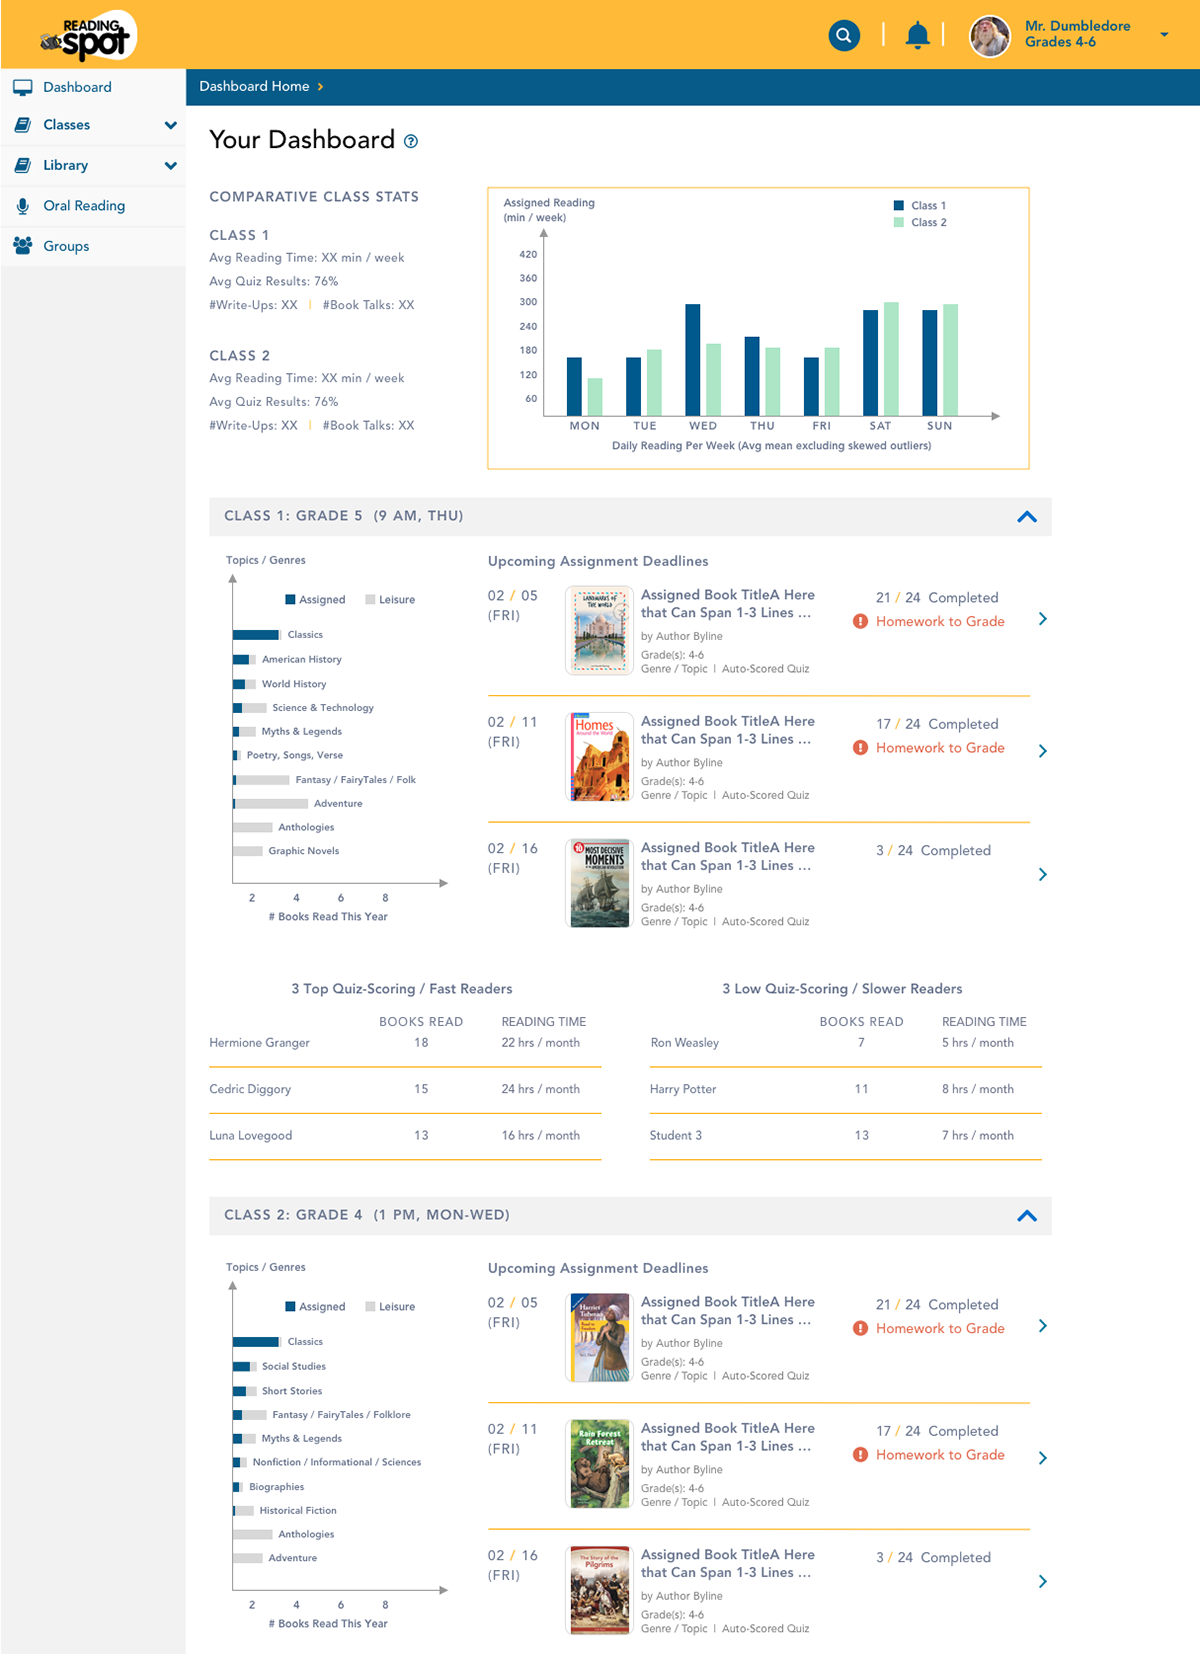
In this wireframe version, I proposed that teachers gain a high-level comparative view of class performance. Unlike version 2, this design version features a bar chart that compares how each class is doing in terms of their daily reading per week. In addition, this version displays overall performance for each class that a teacher runs based on their average quiz results, number of write-ups and book talks completed.
Other dashboard concepts I proposed for both designs:
1) Books by Topics / Genres assigned versus leisure. Teachers can see a content breakdown of what the teachers have assigned versus what students have chosen for themselves.My hypothesis is that teachers may find it helpful to get a high-level view of the distribution of content across genres when they consider supplemental readings recommendations.
2) Notifications on total number of new assignments that teachers must grade that have been completed by students. I organized the assignments by most urgent due dates for immediate action and also highlighted those assignments that have a new homework to grade to keep the content fresh and relevant daily to organize teachers' call-to-actions.
2) Notifications on total number of new assignments that teachers must grade that have been completed by students. I organized the assignments by most urgent due dates for immediate action and also highlighted those assignments that have a new homework to grade to keep the content fresh and relevant daily to organize teachers' call-to-actions.
3) Stats on the 3 top performing students on quizzes and the 3 lowest performing ones to enable teachers to know with whom to prioritize their time helping those who are struggling. Correlating the amount of books read and reading time with quiz results may enable teachers to know if students are spending enough time reading and getting the results that are expected for effort.
4) Accordion tabs to enable teacher to open and close tabs to see dashboard overviews for each class yet reduce some visual clutter.
Teachers' Dashboard
Version 2:
Version 2:
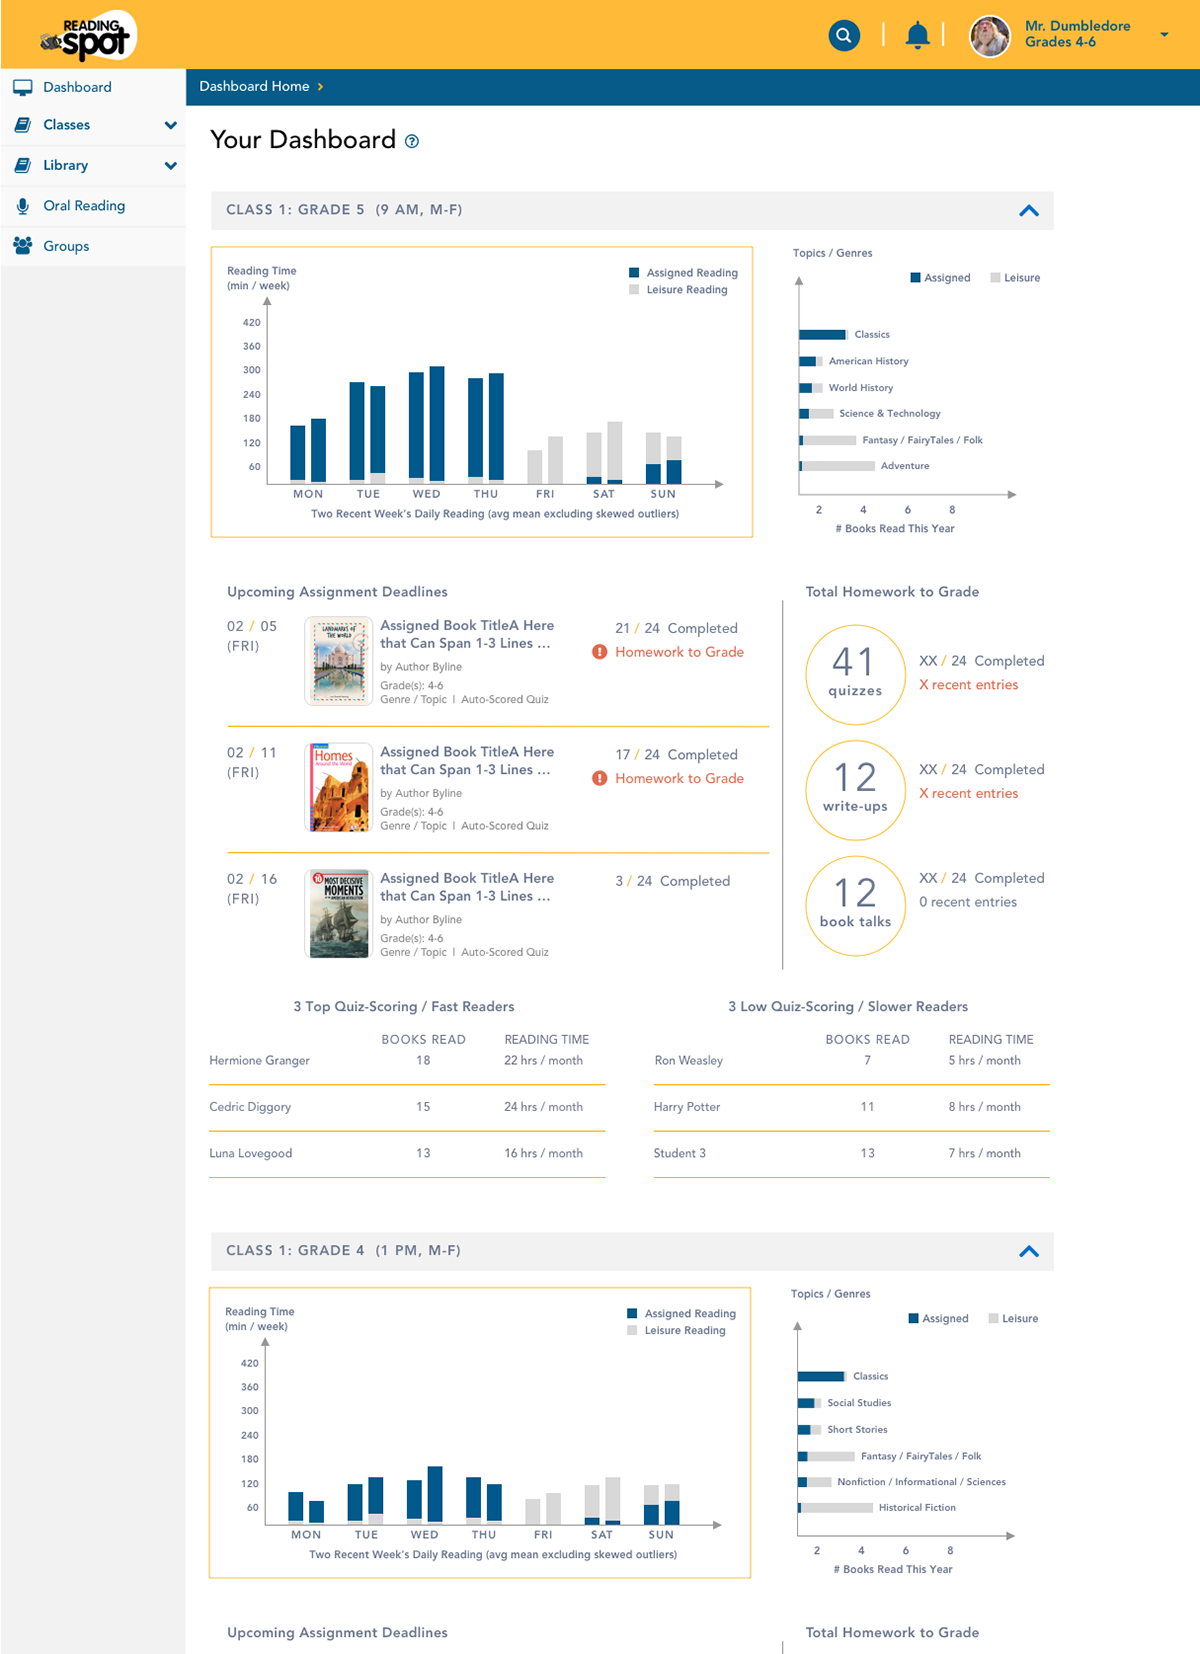
Time spent reading assigned reading vs leisure reading given larger weight in this second dashboard wireframe concept. The quantity of homework to grade is also emphasized more here in this version unlike version 1.
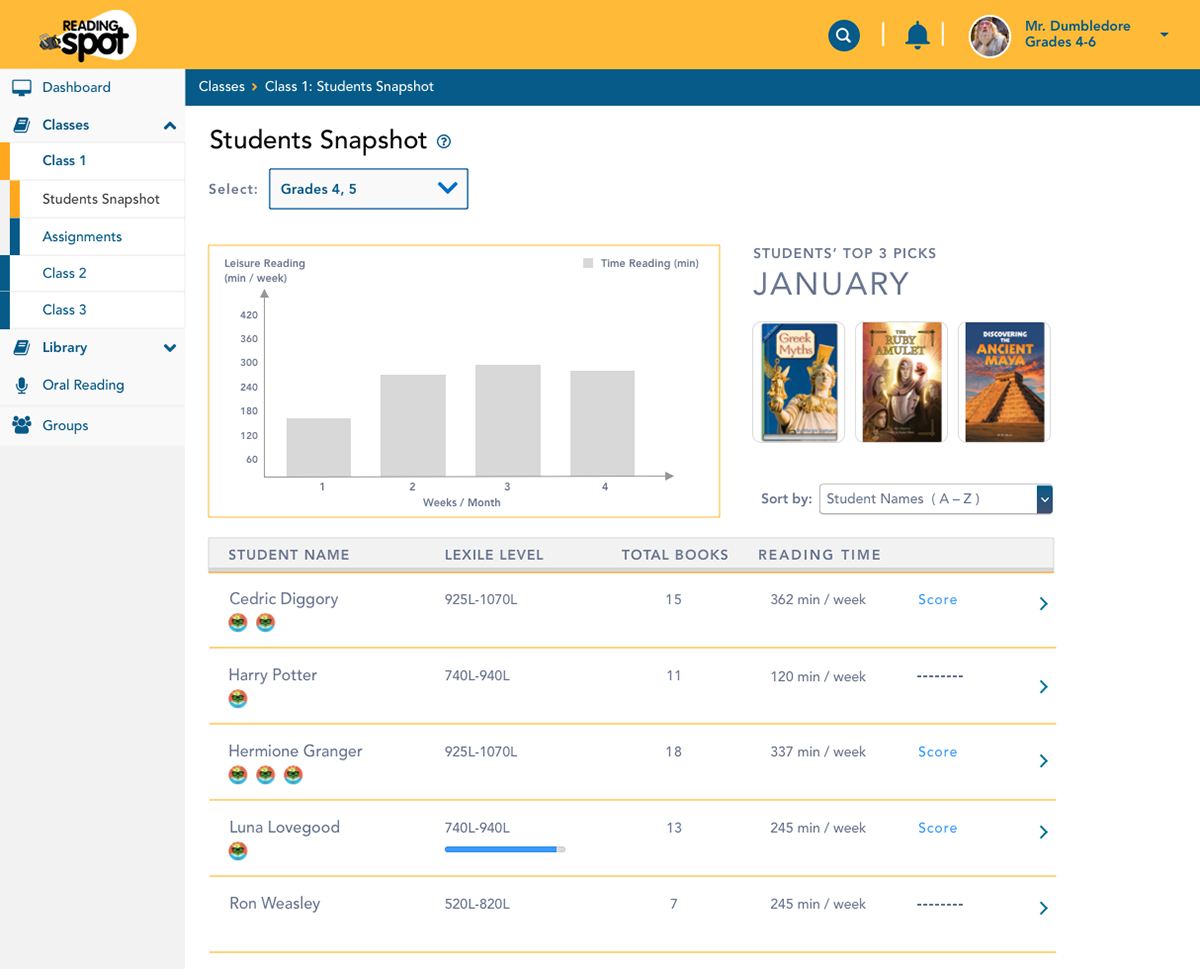
Student's Dashboard Design Ideations
Featured directly below are two UX concepts for Student's Dashboard that I proposed that illustrate my ideas for potential data visualizations. These designs represent my proposed features for Reading Spot that would enable teachers to gain insights into how students' literacy levels were improving when considering time spent reading. The visual and IA design framework with the yellow chrome was mostly limited to the legacy ReadingSpot design but these features I proposed here would be potentially rolled into future scope.
Student's Dashboard
Version 1:
Version 1:
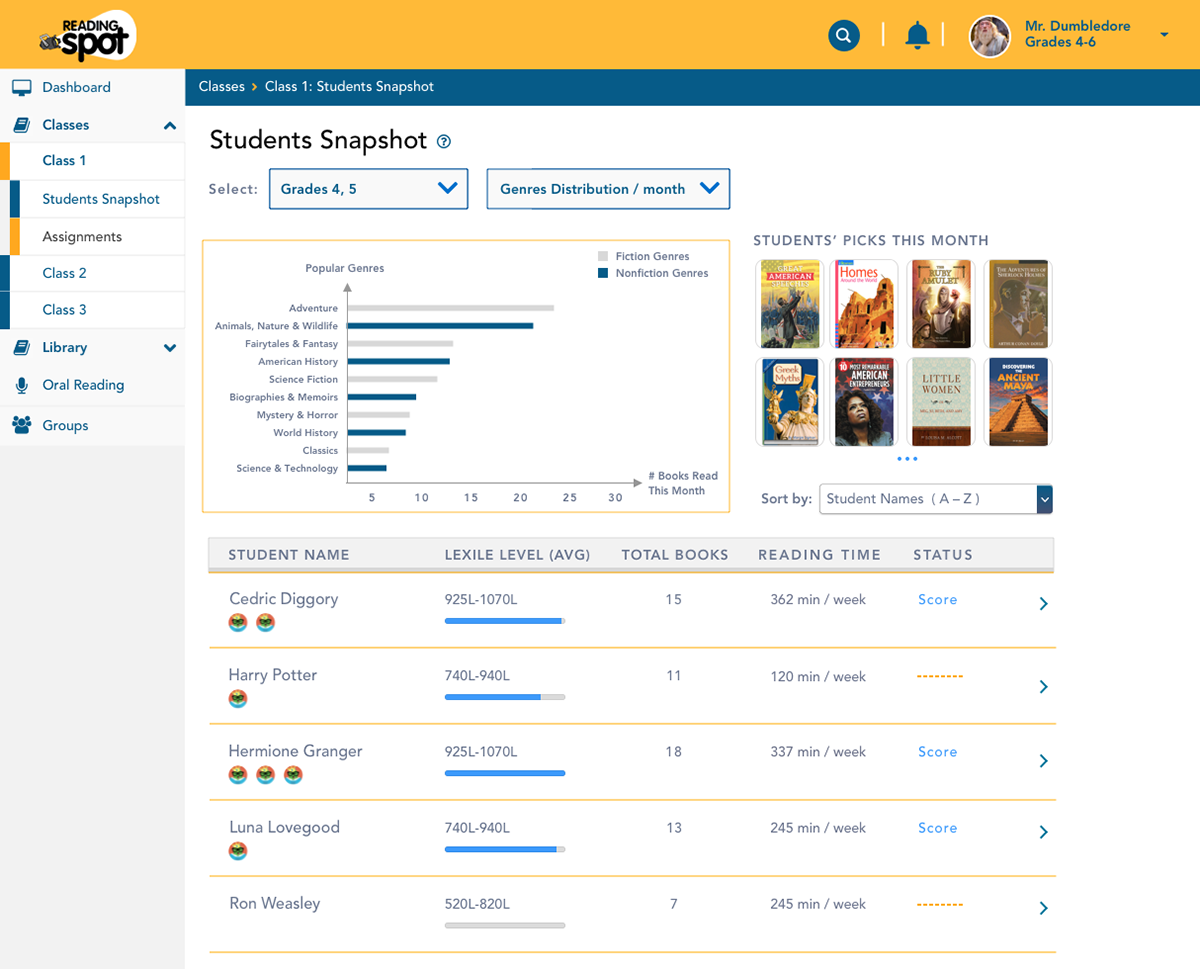
This concept puts the emphasis on presenting genres that the students have read to provide more insight into the students' personality and preferences.
I recommended that we present bar charts in this dashboard to visually quantify the various genres that the students have read. I studied the genres Savvas used and compared it to as well as what their top-tier industry peers when I proposed these genres. I proposed books could also be grouped by fiction and non-fiction a
My hypothesis was that this data visualization would provide more insights into the genres distribution that a specific class has chosen to read. If the teacher then thought that the students should consider other genres, the teacher could recommend alternatives.
Student's Dashboard
Version 2:
Version 2:
This design focuses on time spent reading per client request. I proposed that we add some context into how time spent reading corresponds to students' performance on reading proficiency to reading time in assessing students' comprehension of content relative to their level of effort.
My hypothesis was that simply getting information on time spent reading was NOT helpful unless we also considered their academic performance on tests related to the reading. If the students barely read and had poor test scores, I reasoned that we could then make more effort to inspire or influence the student to spend more time reading.
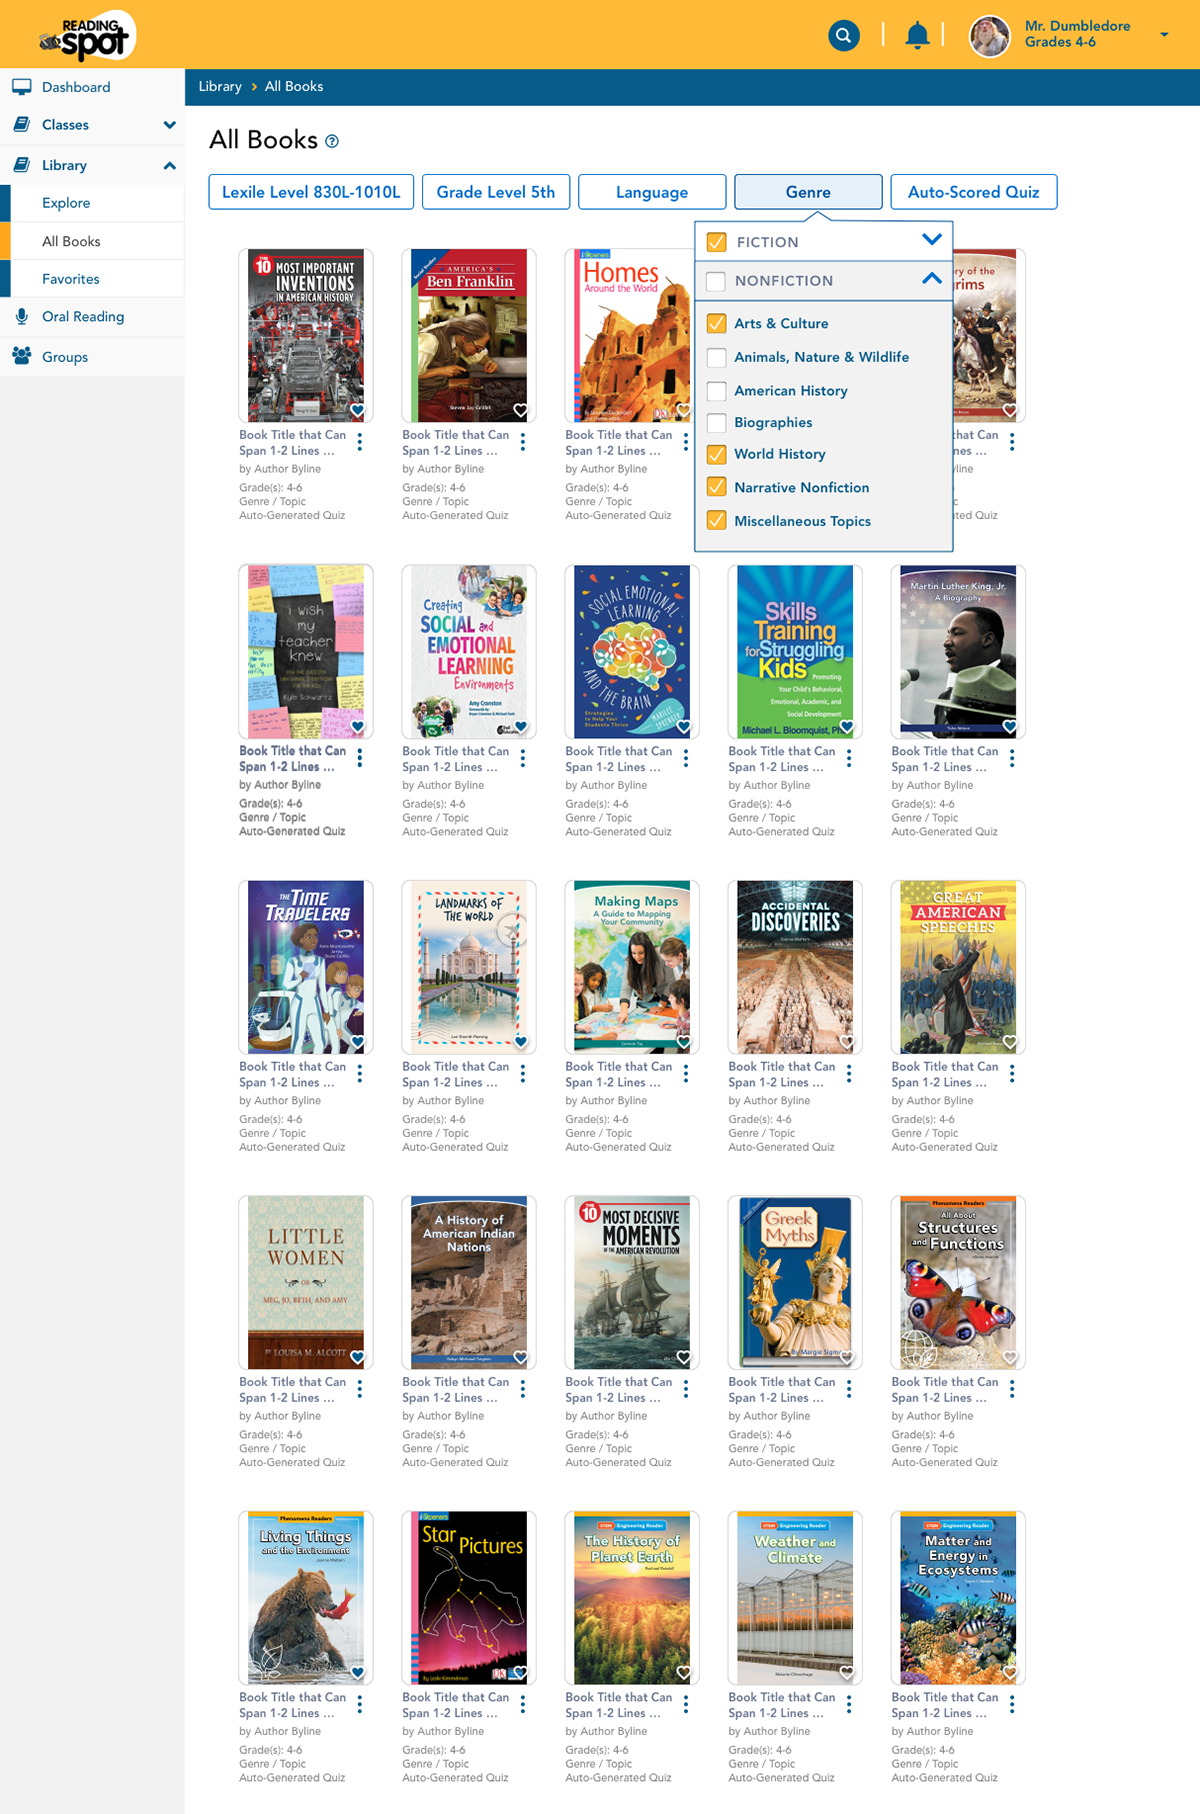
Non-Fiction filter concept (v1)
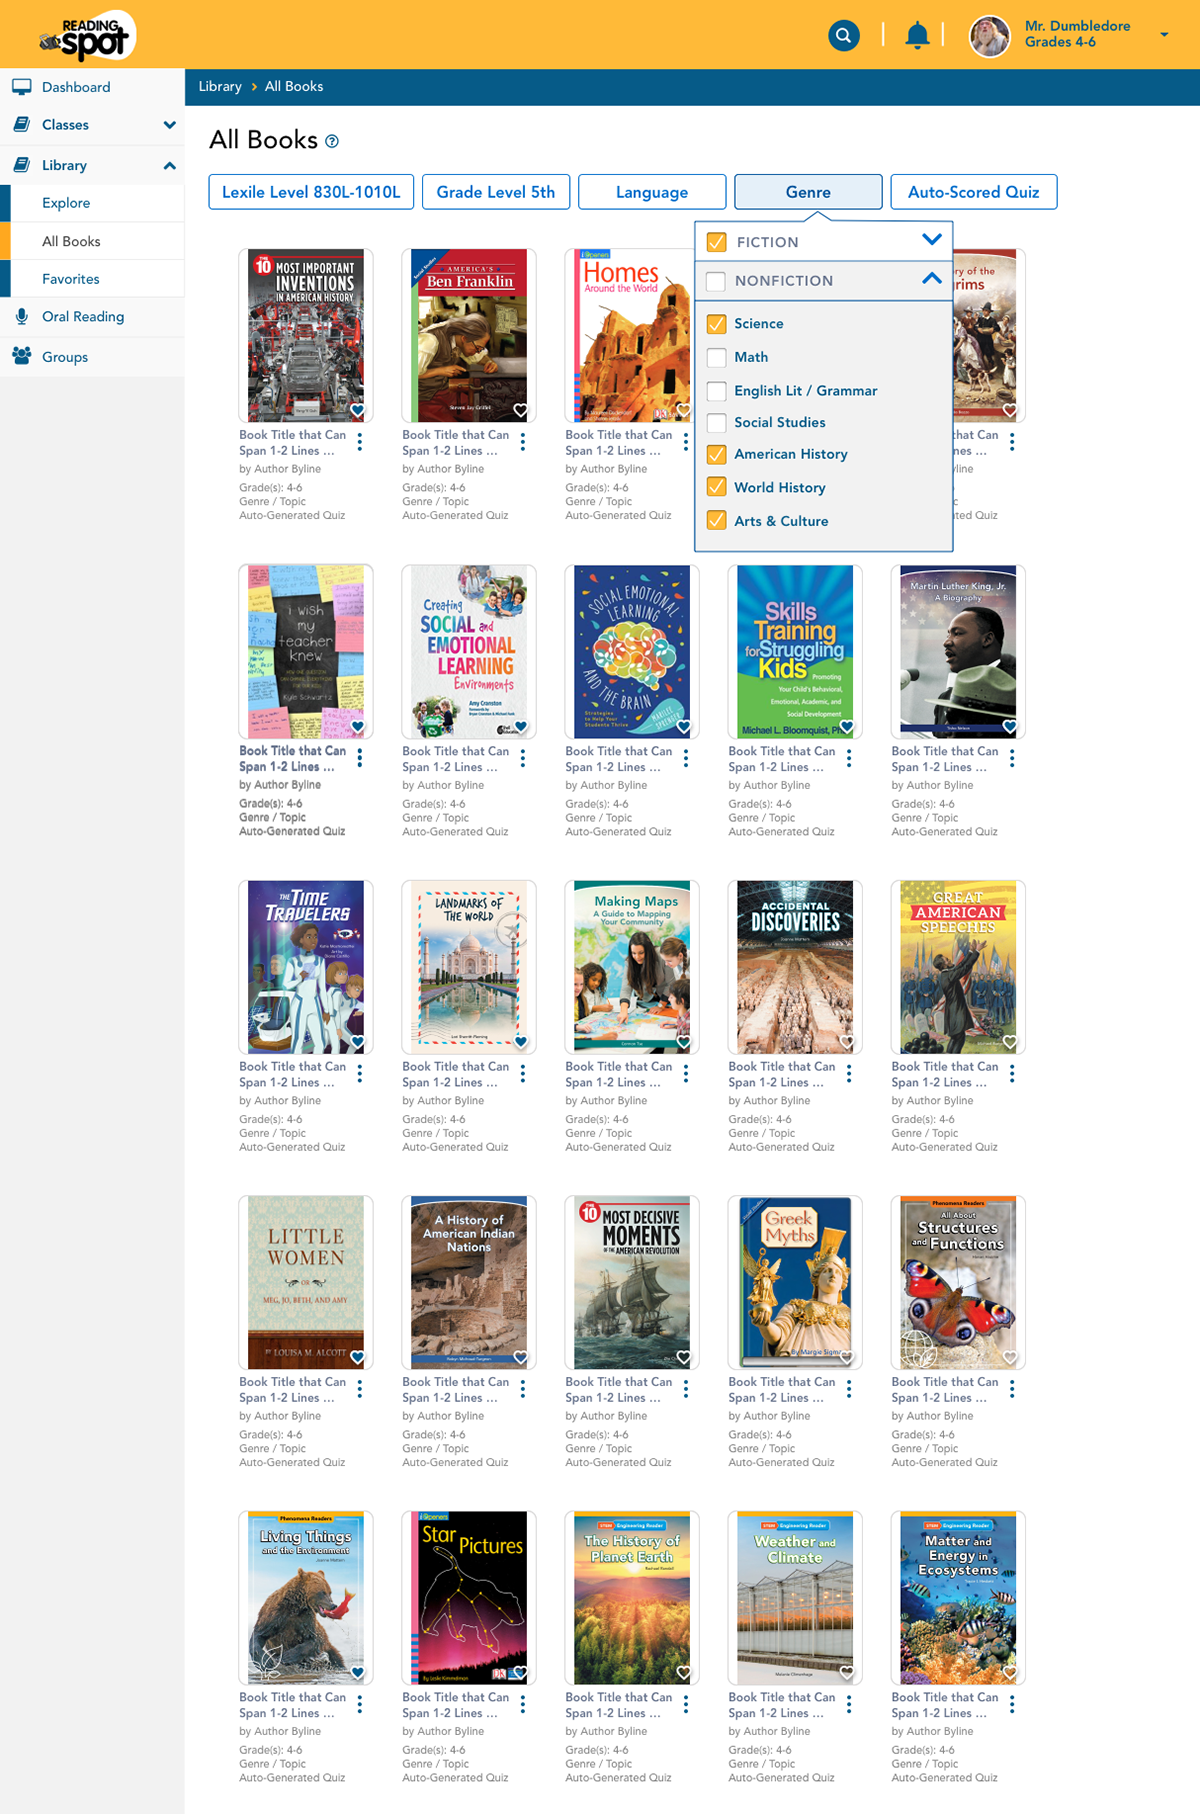
Non-Fiction filter concept (v2)
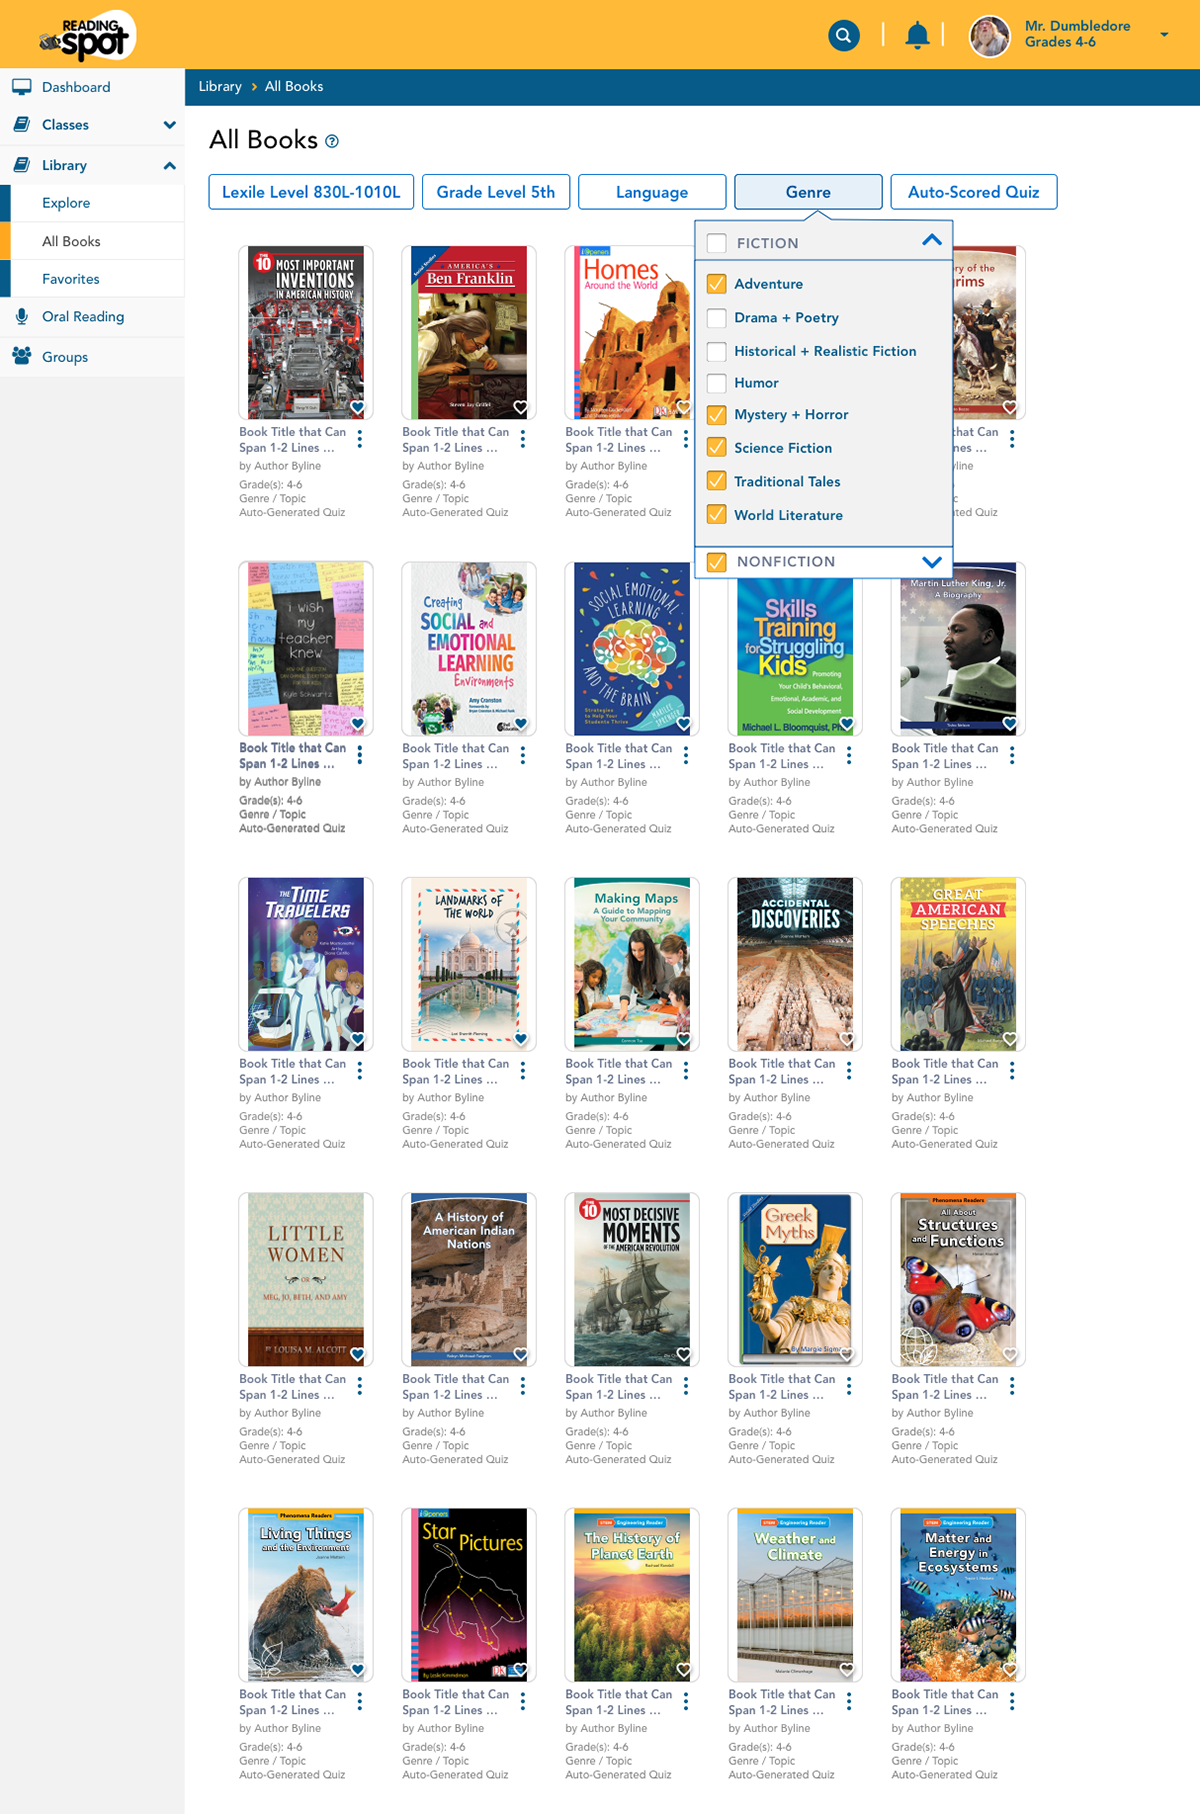
Fiction Filter concept
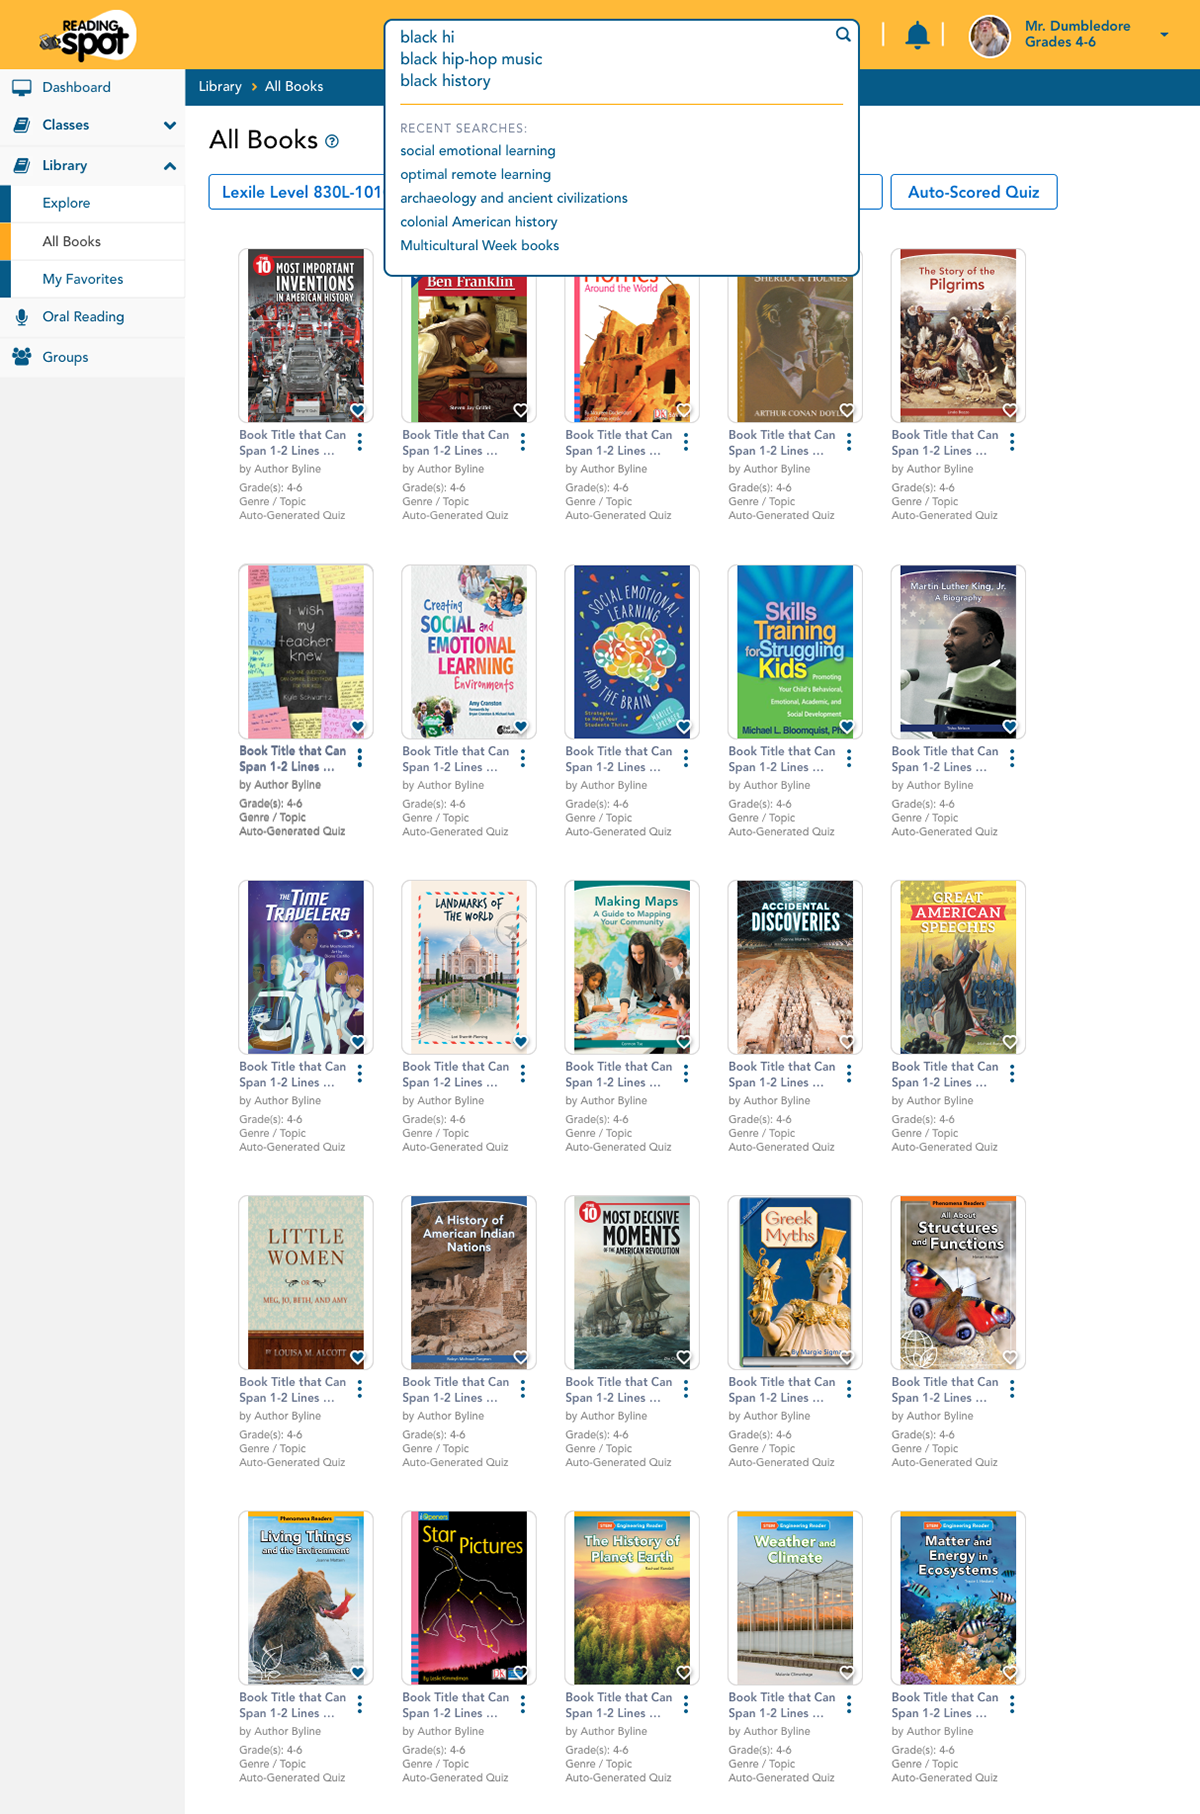
Typeahead
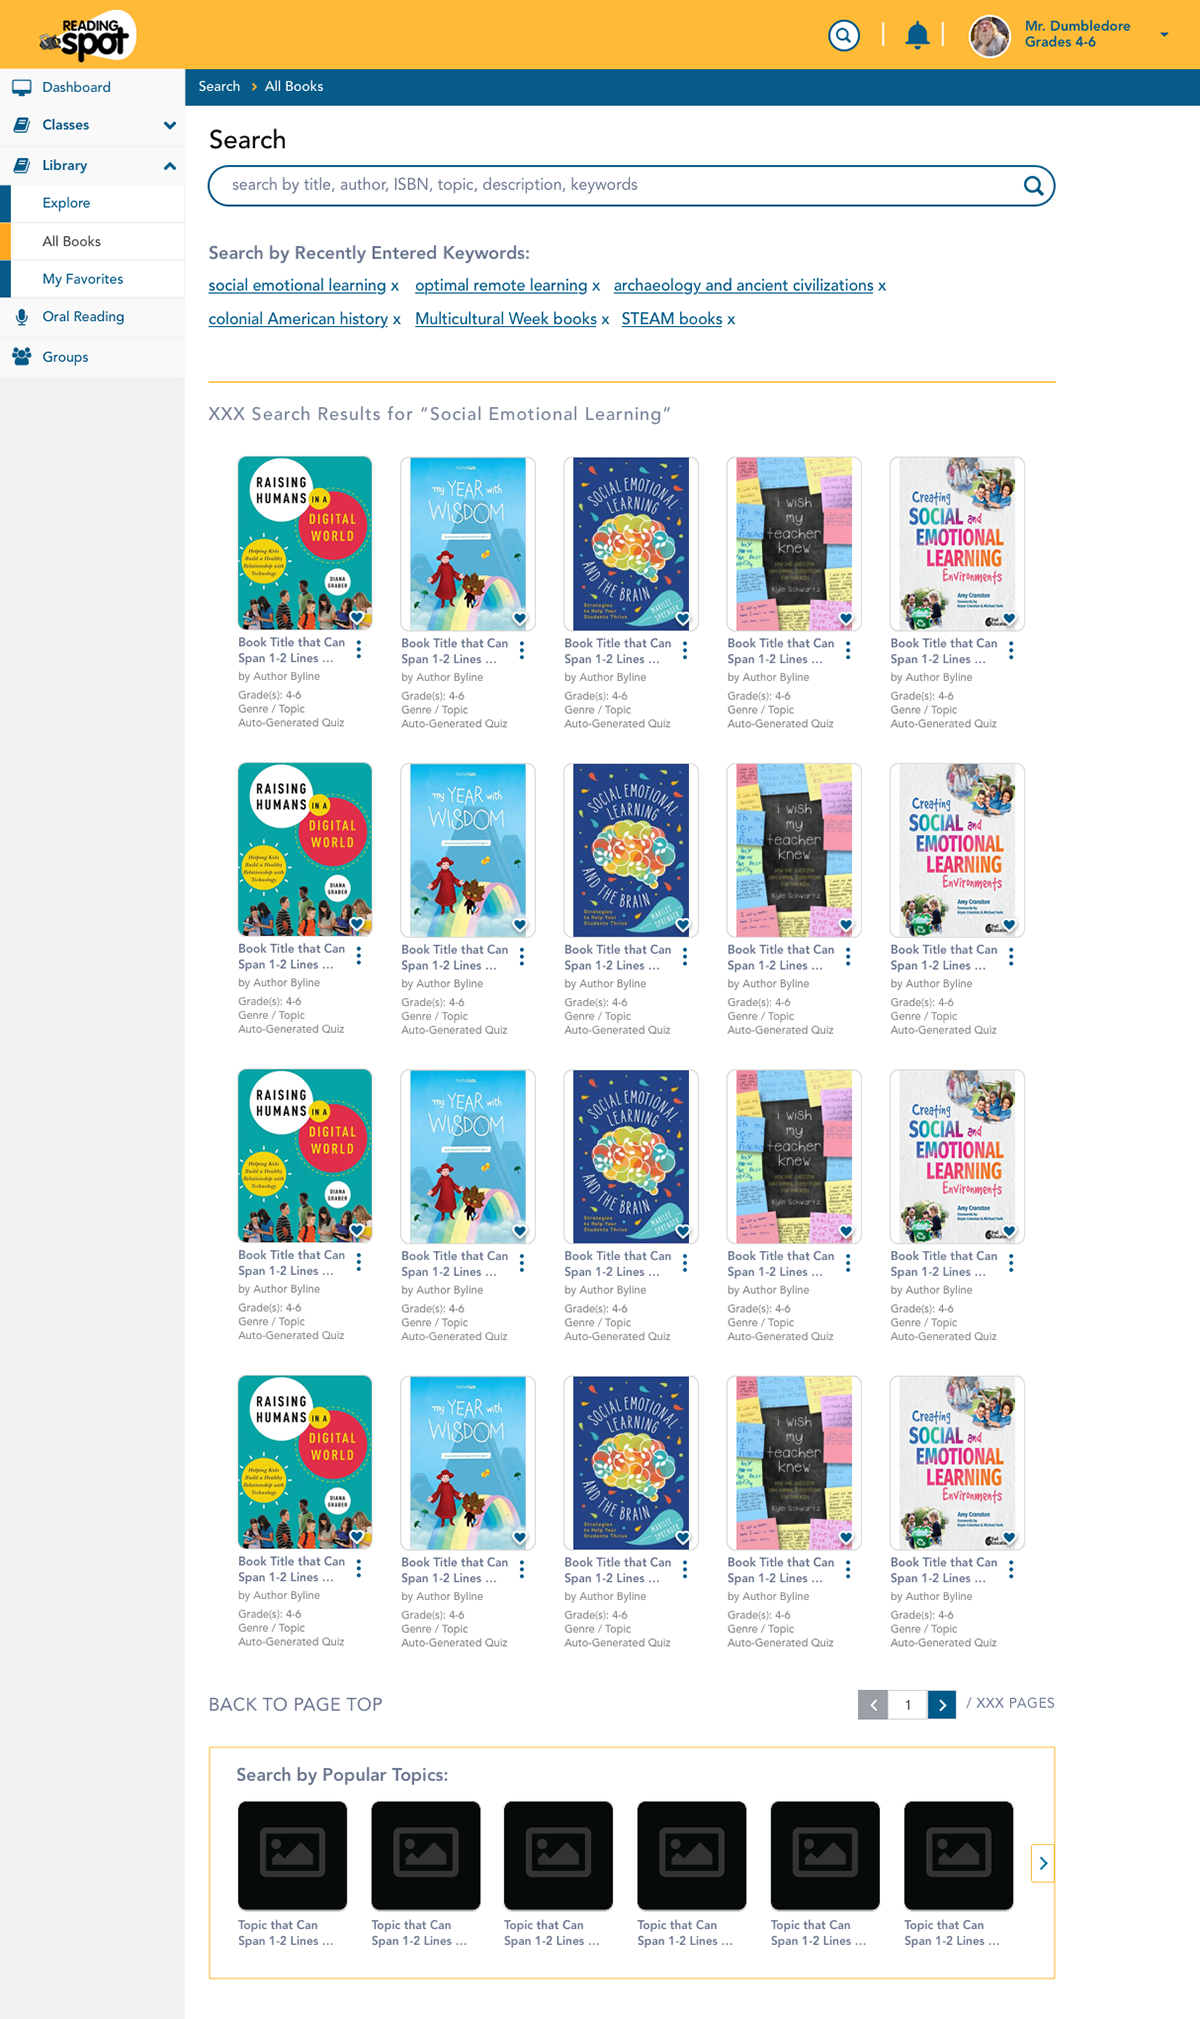
Search page
PROJECT DETAIL: SuccessMaker PreK-8 EdTech Design
SuccessMaker is a K-8 math and literacy intervention and supplemental program that launched at Stanford in collaboration with IBM and now has 50+ years of proven results. Their adaptive learning app widely used in schools enables teachers and district admin to assign, personalize, and track individual students' and group performance in math and reading to meet academic standards and requirements. It offers 100,000+ math exercises and 1,640 learning objectives. It’s also CASE-certified for special education. SuccessMaker Reading focuses on: 1) phonics, 2) phonemic awareness, concepts of print, 3) vocabulary, 4) grammar, 5) spelling, 6) comprehension, 7) fluency.
Sample Responsive Desktop- and Tablet-Adapted Screens from the SuccessMaker Math and Reading / Literacy Program
UX / UI Product Design:
Homepage, Dashboards for Teachers and Students, Usage Metric Goals
Homepage, Dashboards for Teachers and Students, Usage Metric Goals
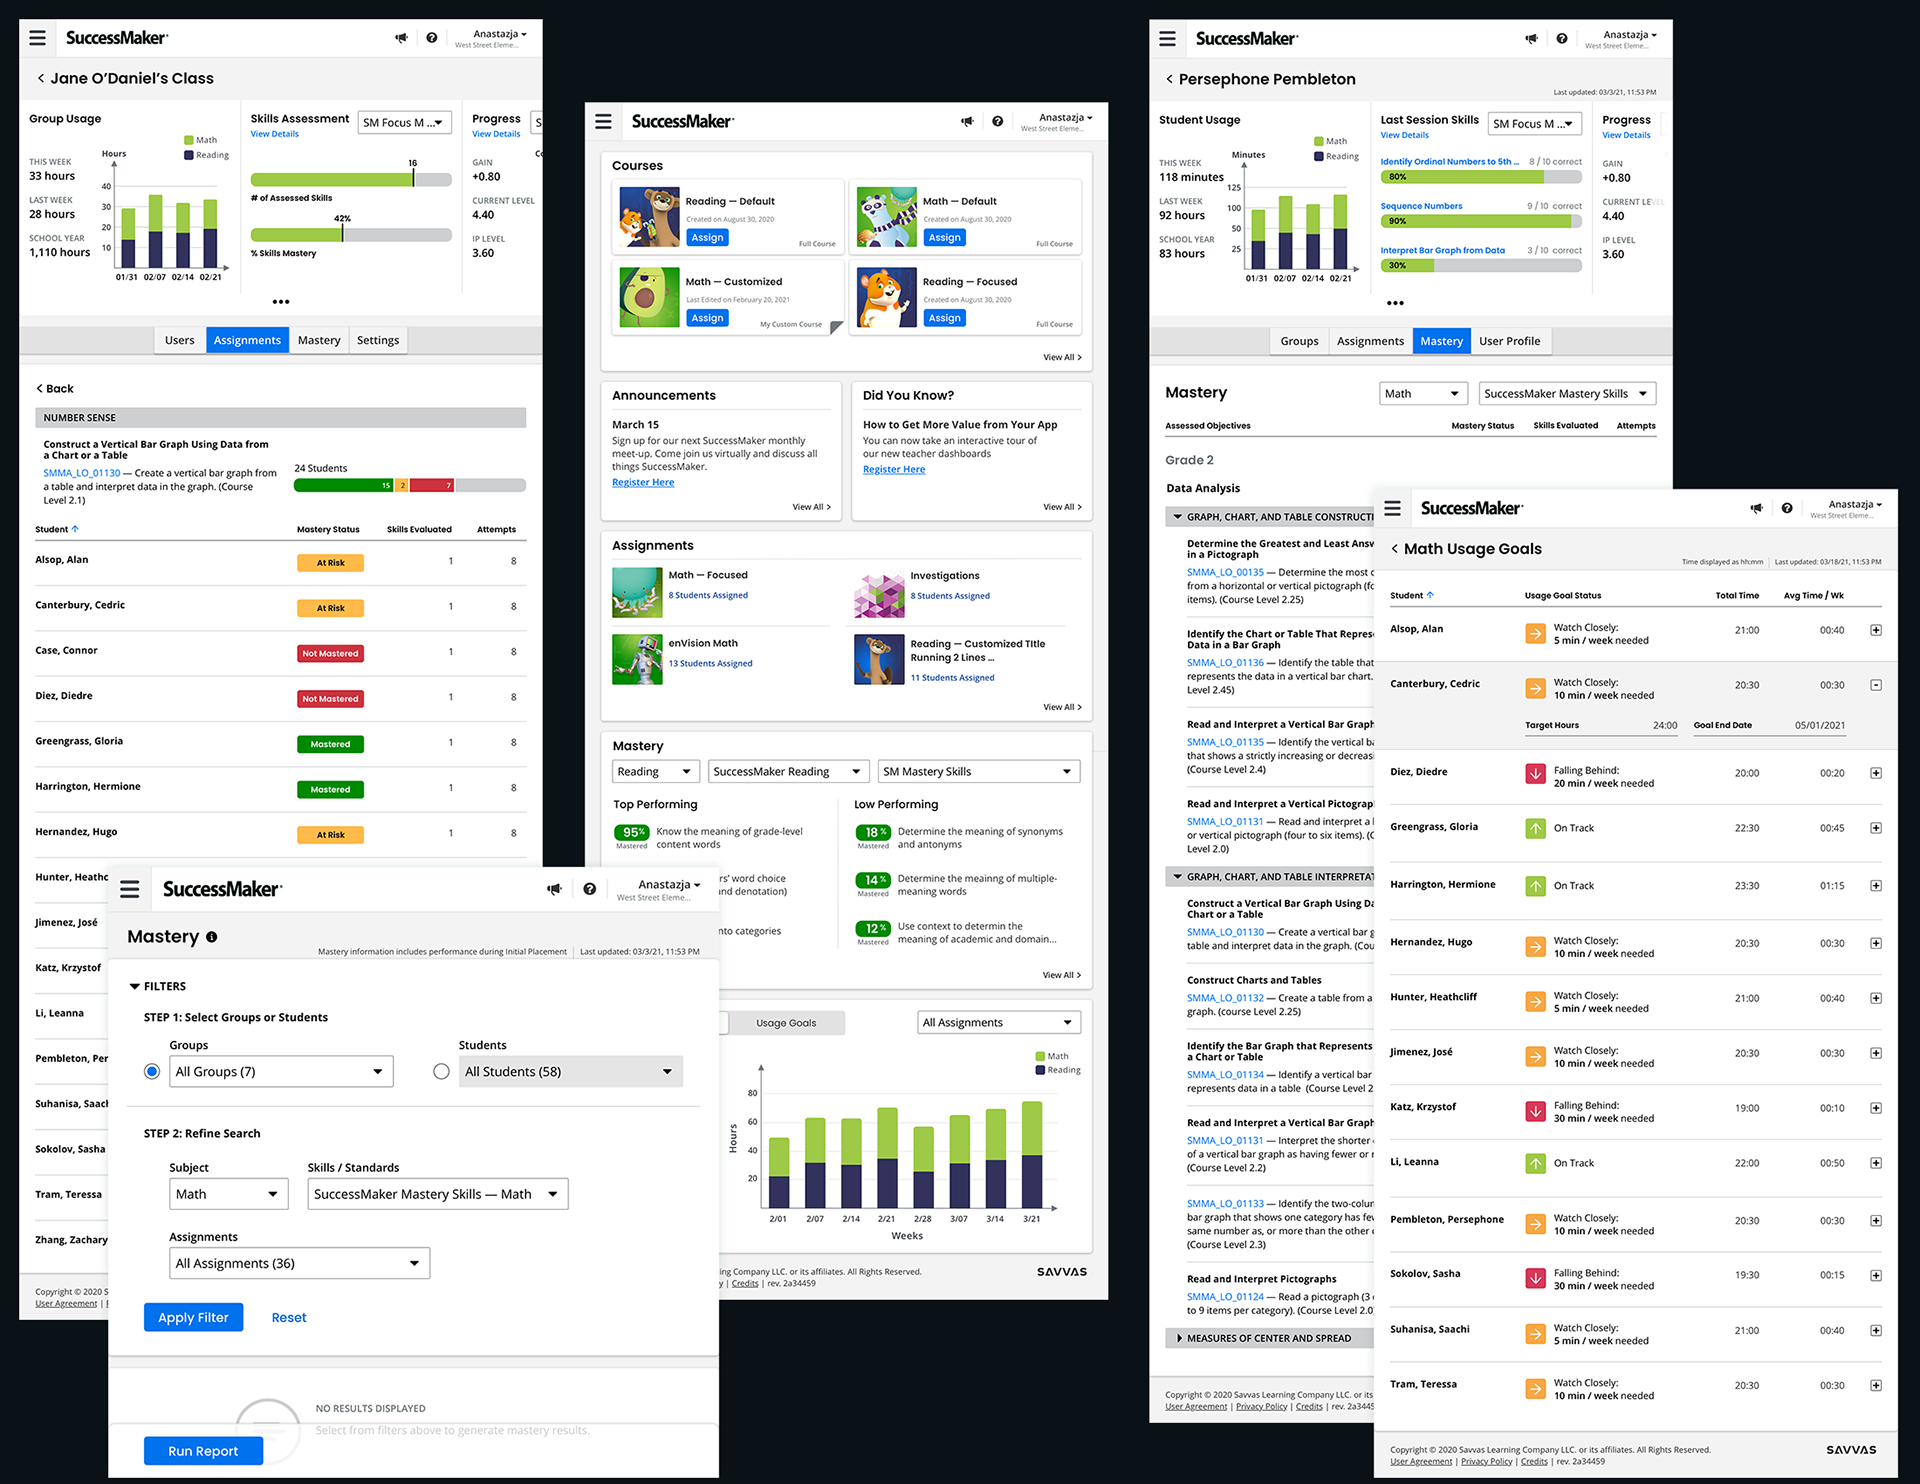
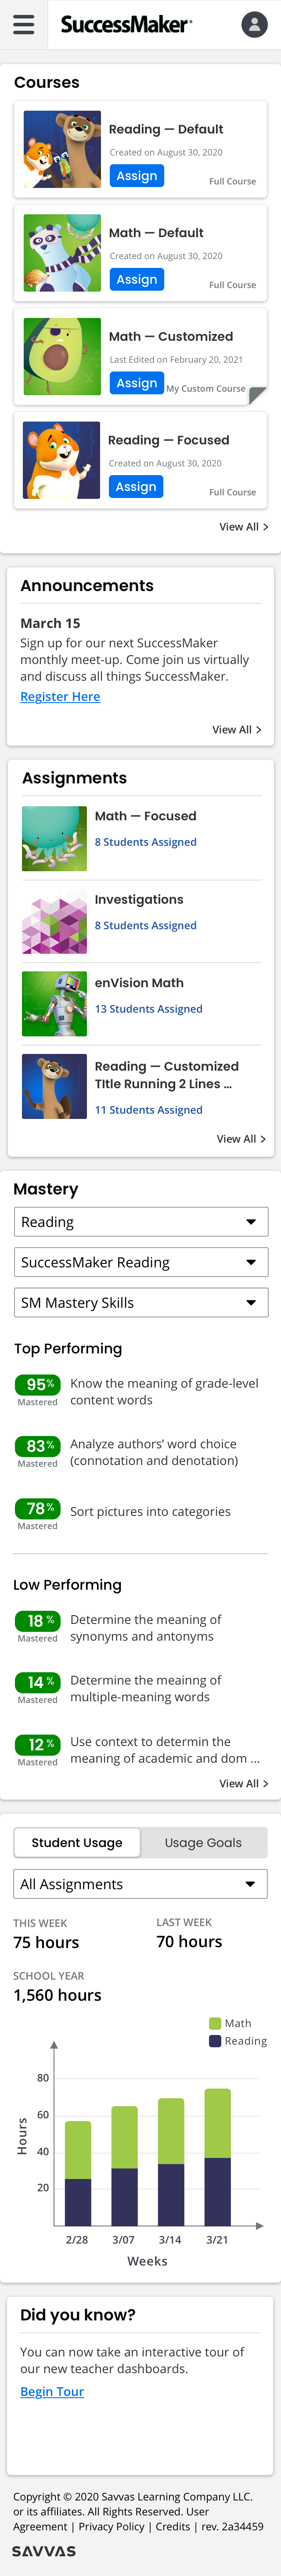
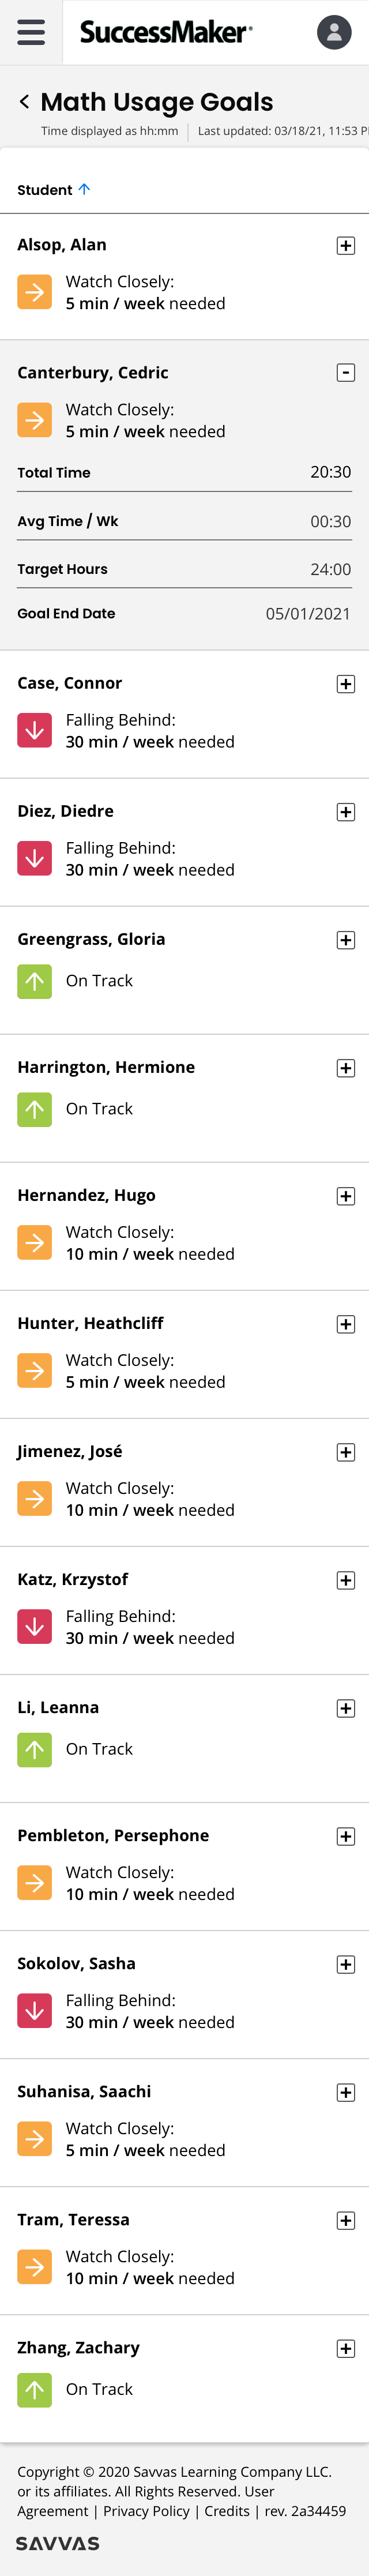
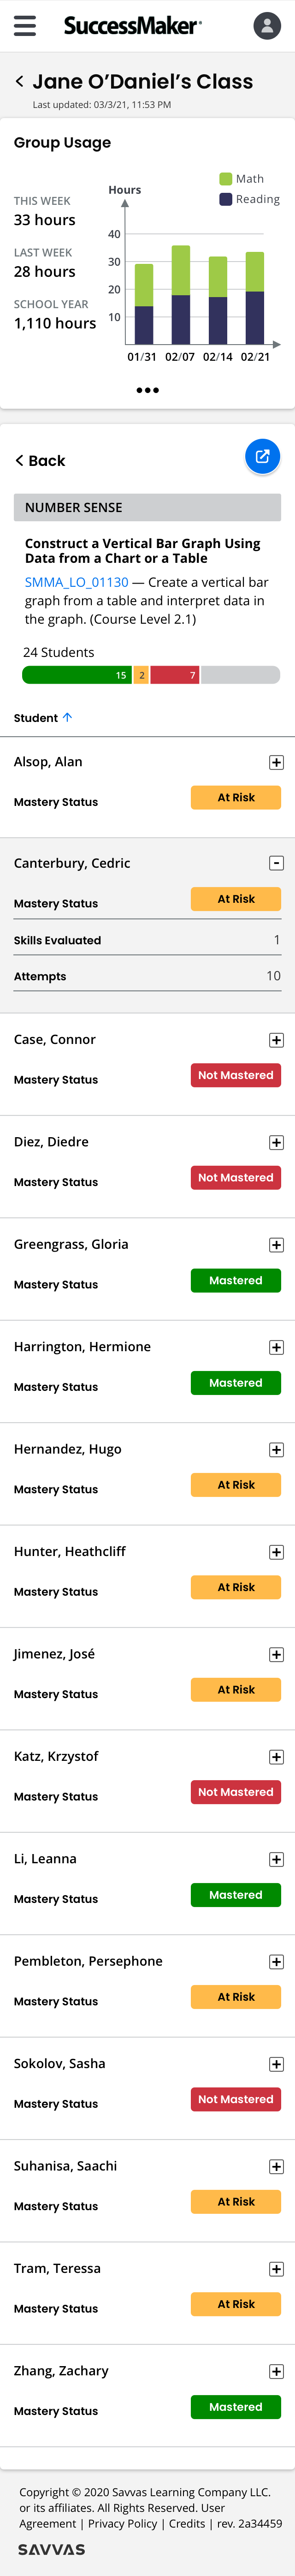
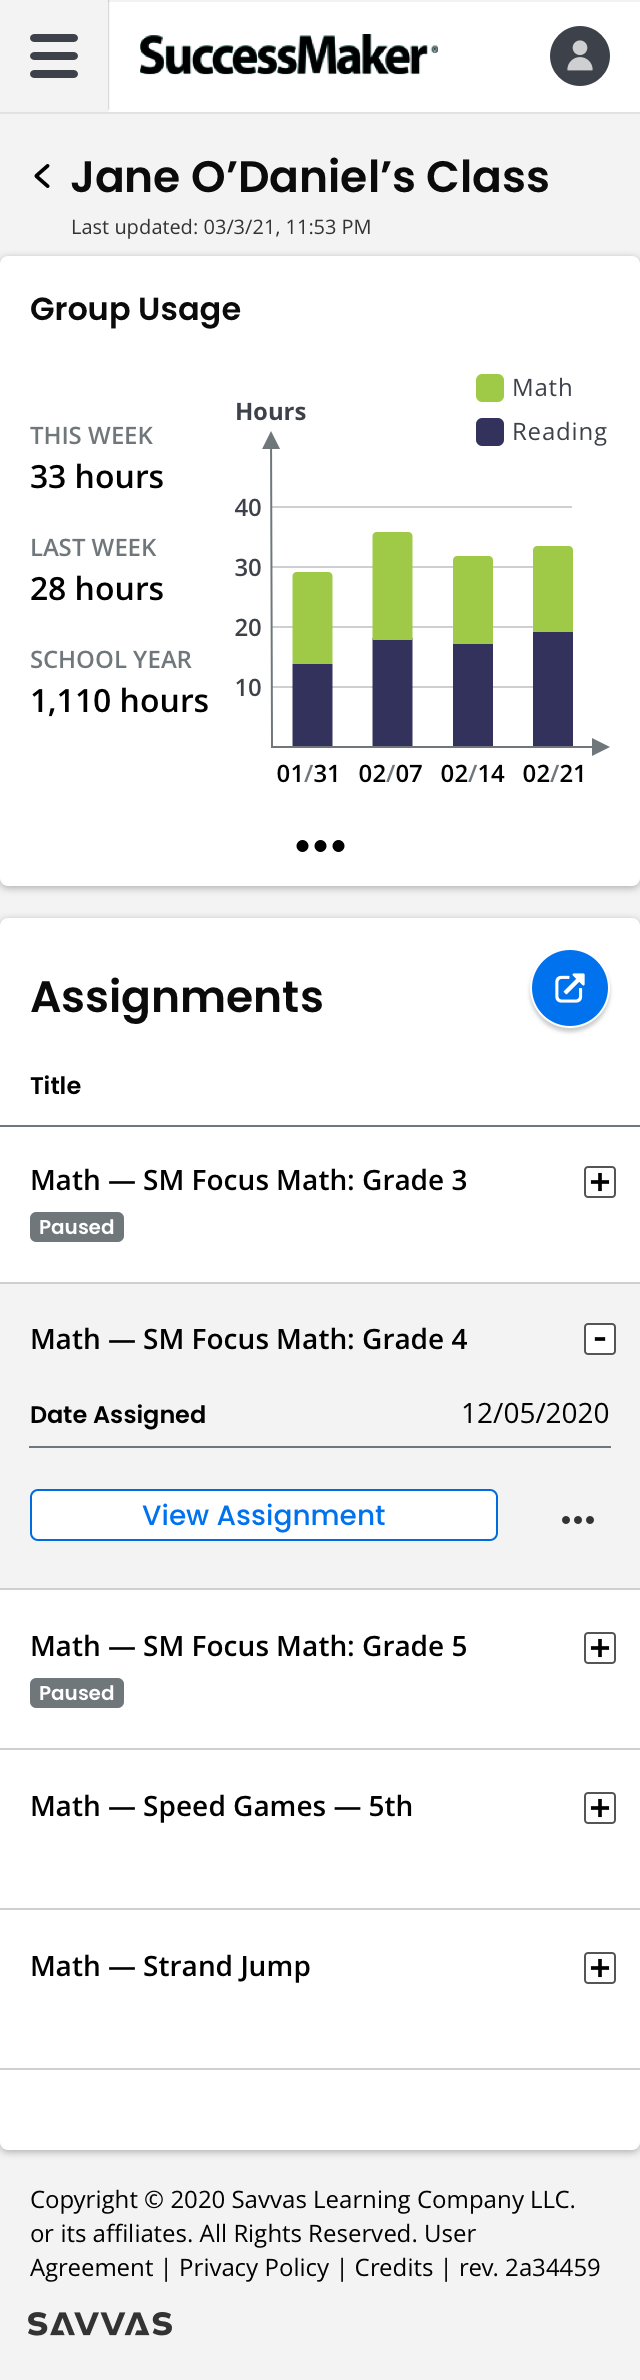
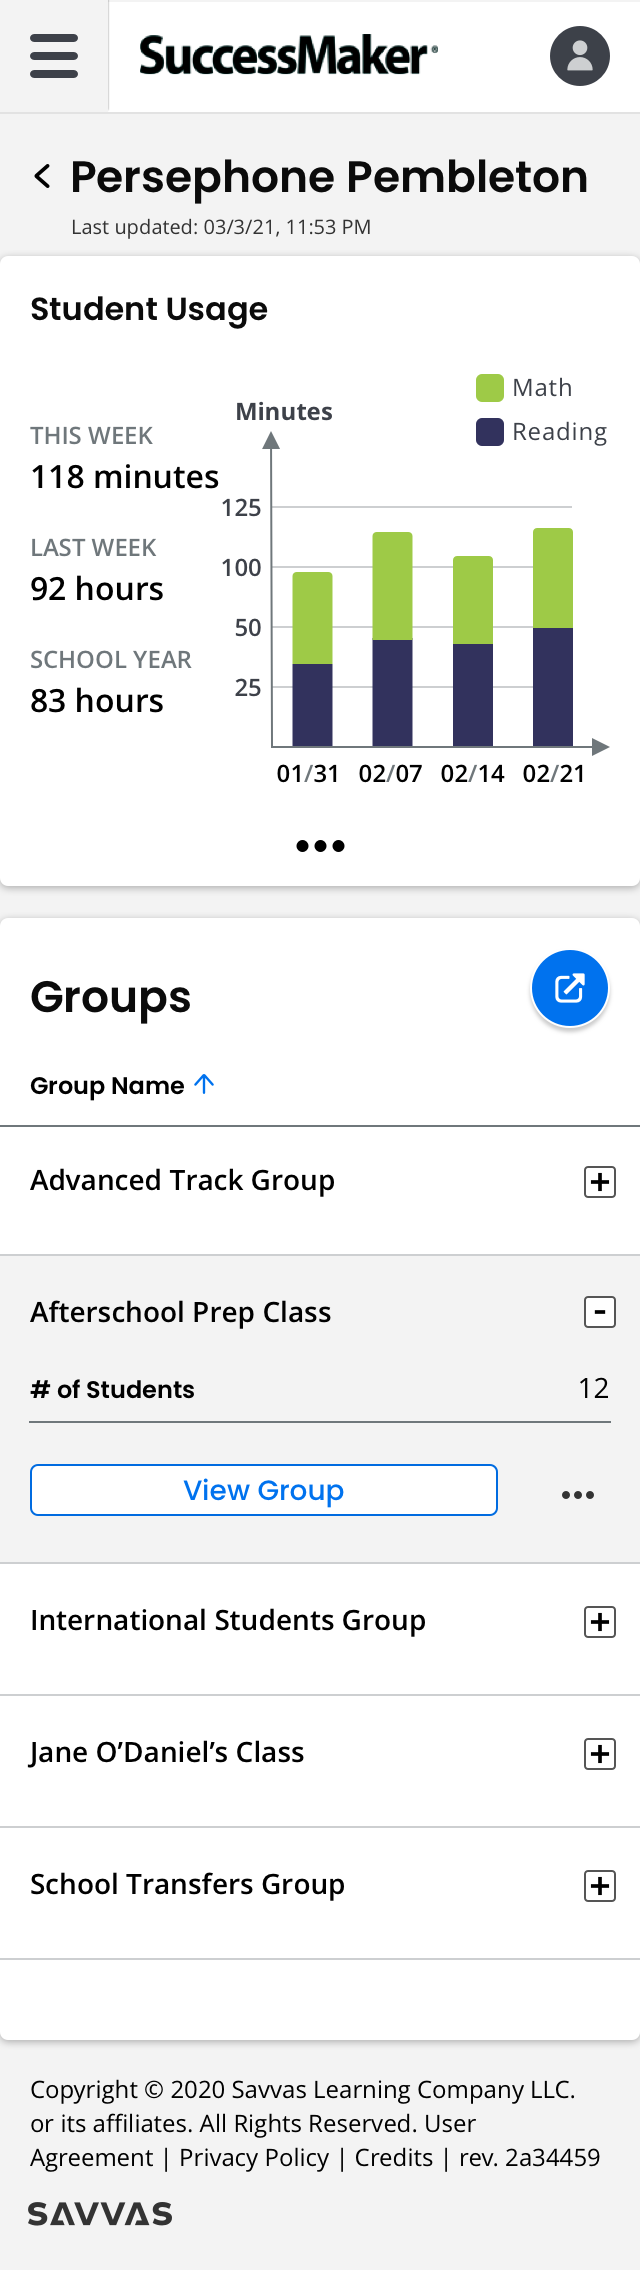
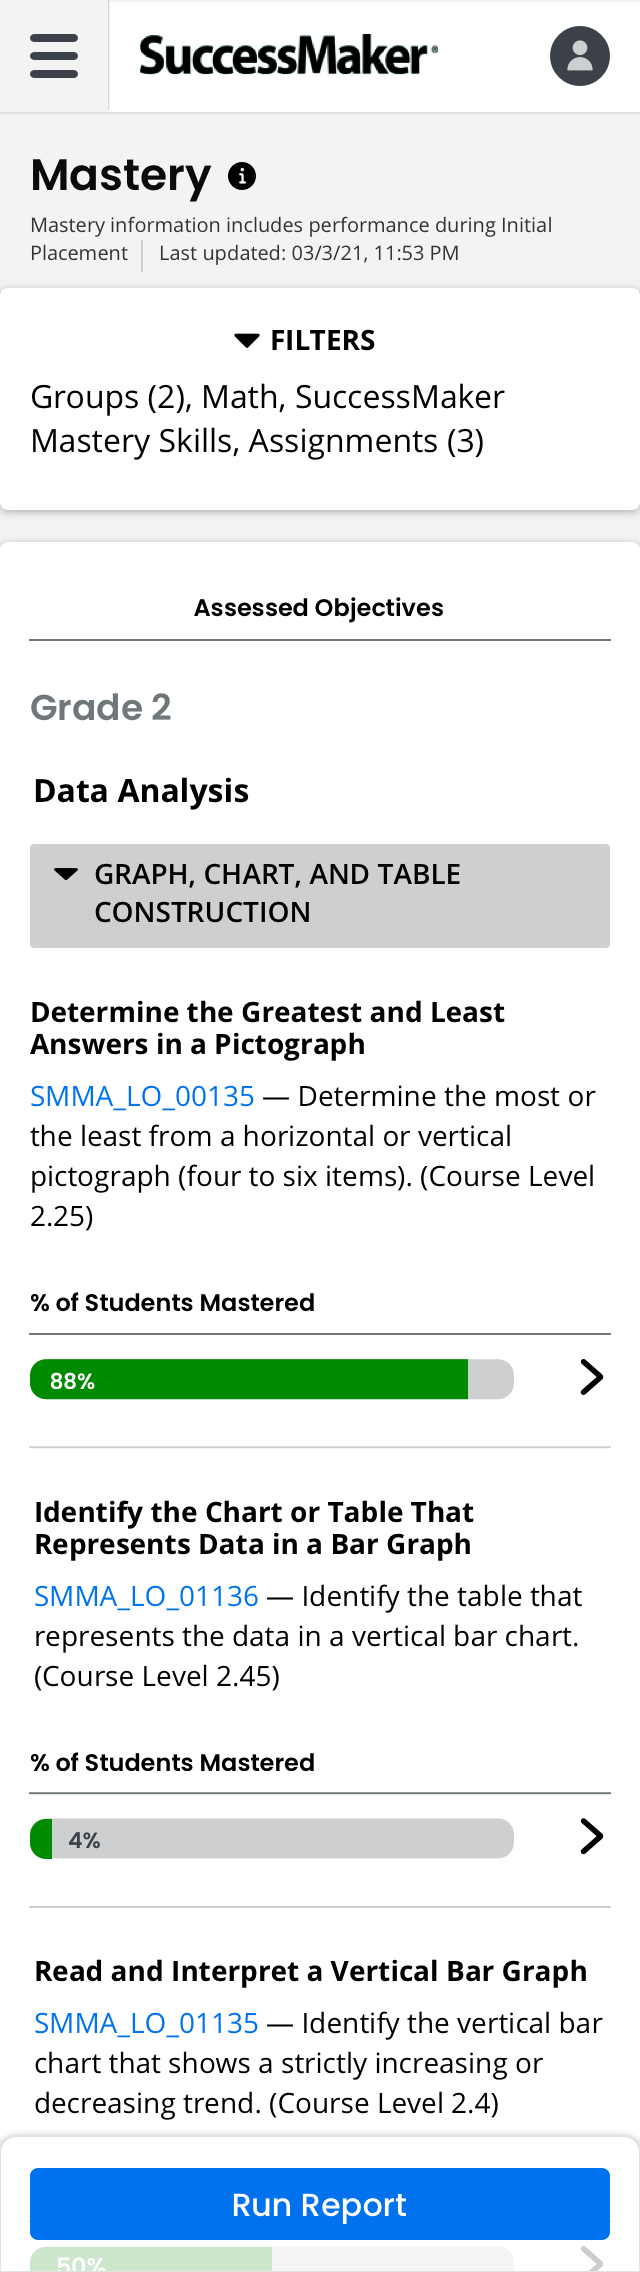
Featured below are sample screens from SuccessMaker's math and reading / literacy edTech app that I collaborated on the UX / UI product design. These are the responsive web designs for this app's desktop, tablet, and mobile formats for the homepage dashboard views for teachers and students to log in and view their study material and performance metrics. We used traffic light symbolism to indicate content areas in which the students were doing well (green), at risk of falling behind (yellow), and not mastered (red). To increase accessibility for the color-blind, I labeled these states as another visual indicator with text or arrows. For the "Math Usage Goals" types of analytic pages, I proposed accordion tabs to present a more visually concise layout and highlighted only a couple key information such as their performance status (e.g. On Track, Watch Closely, and Falling Behind and their actionable app usage stats. I proposed other features like composite bar charts to see the breakdown of time spent studying on math versus reading for more insight into student study habits and performance.
Featured below are the corresponding mobile screens to the responsive desktop and tablet displays above.
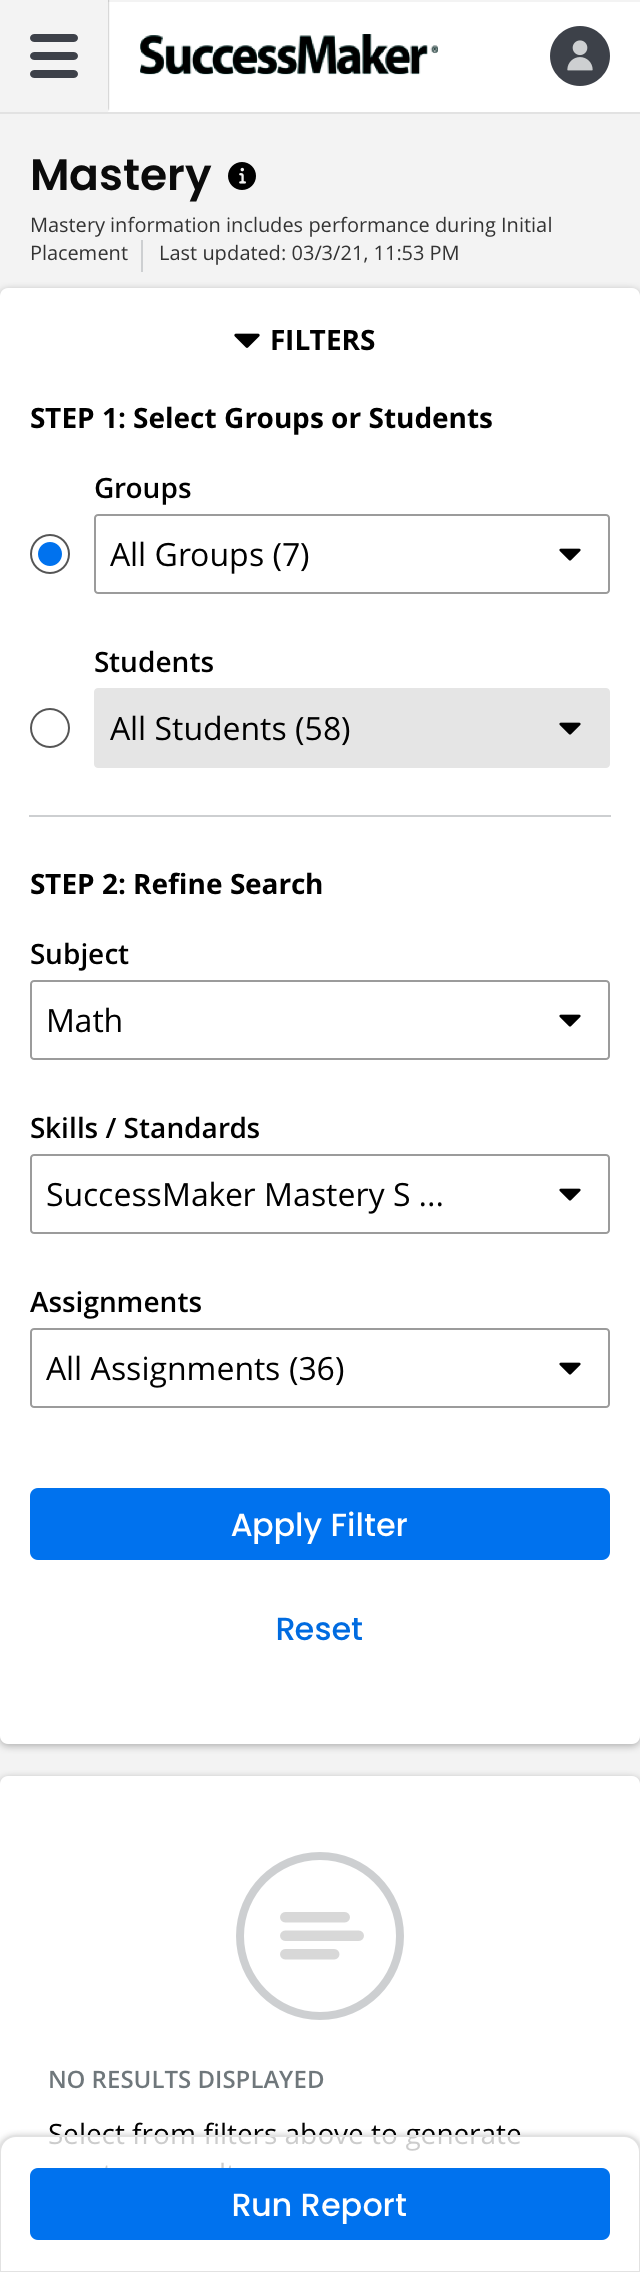
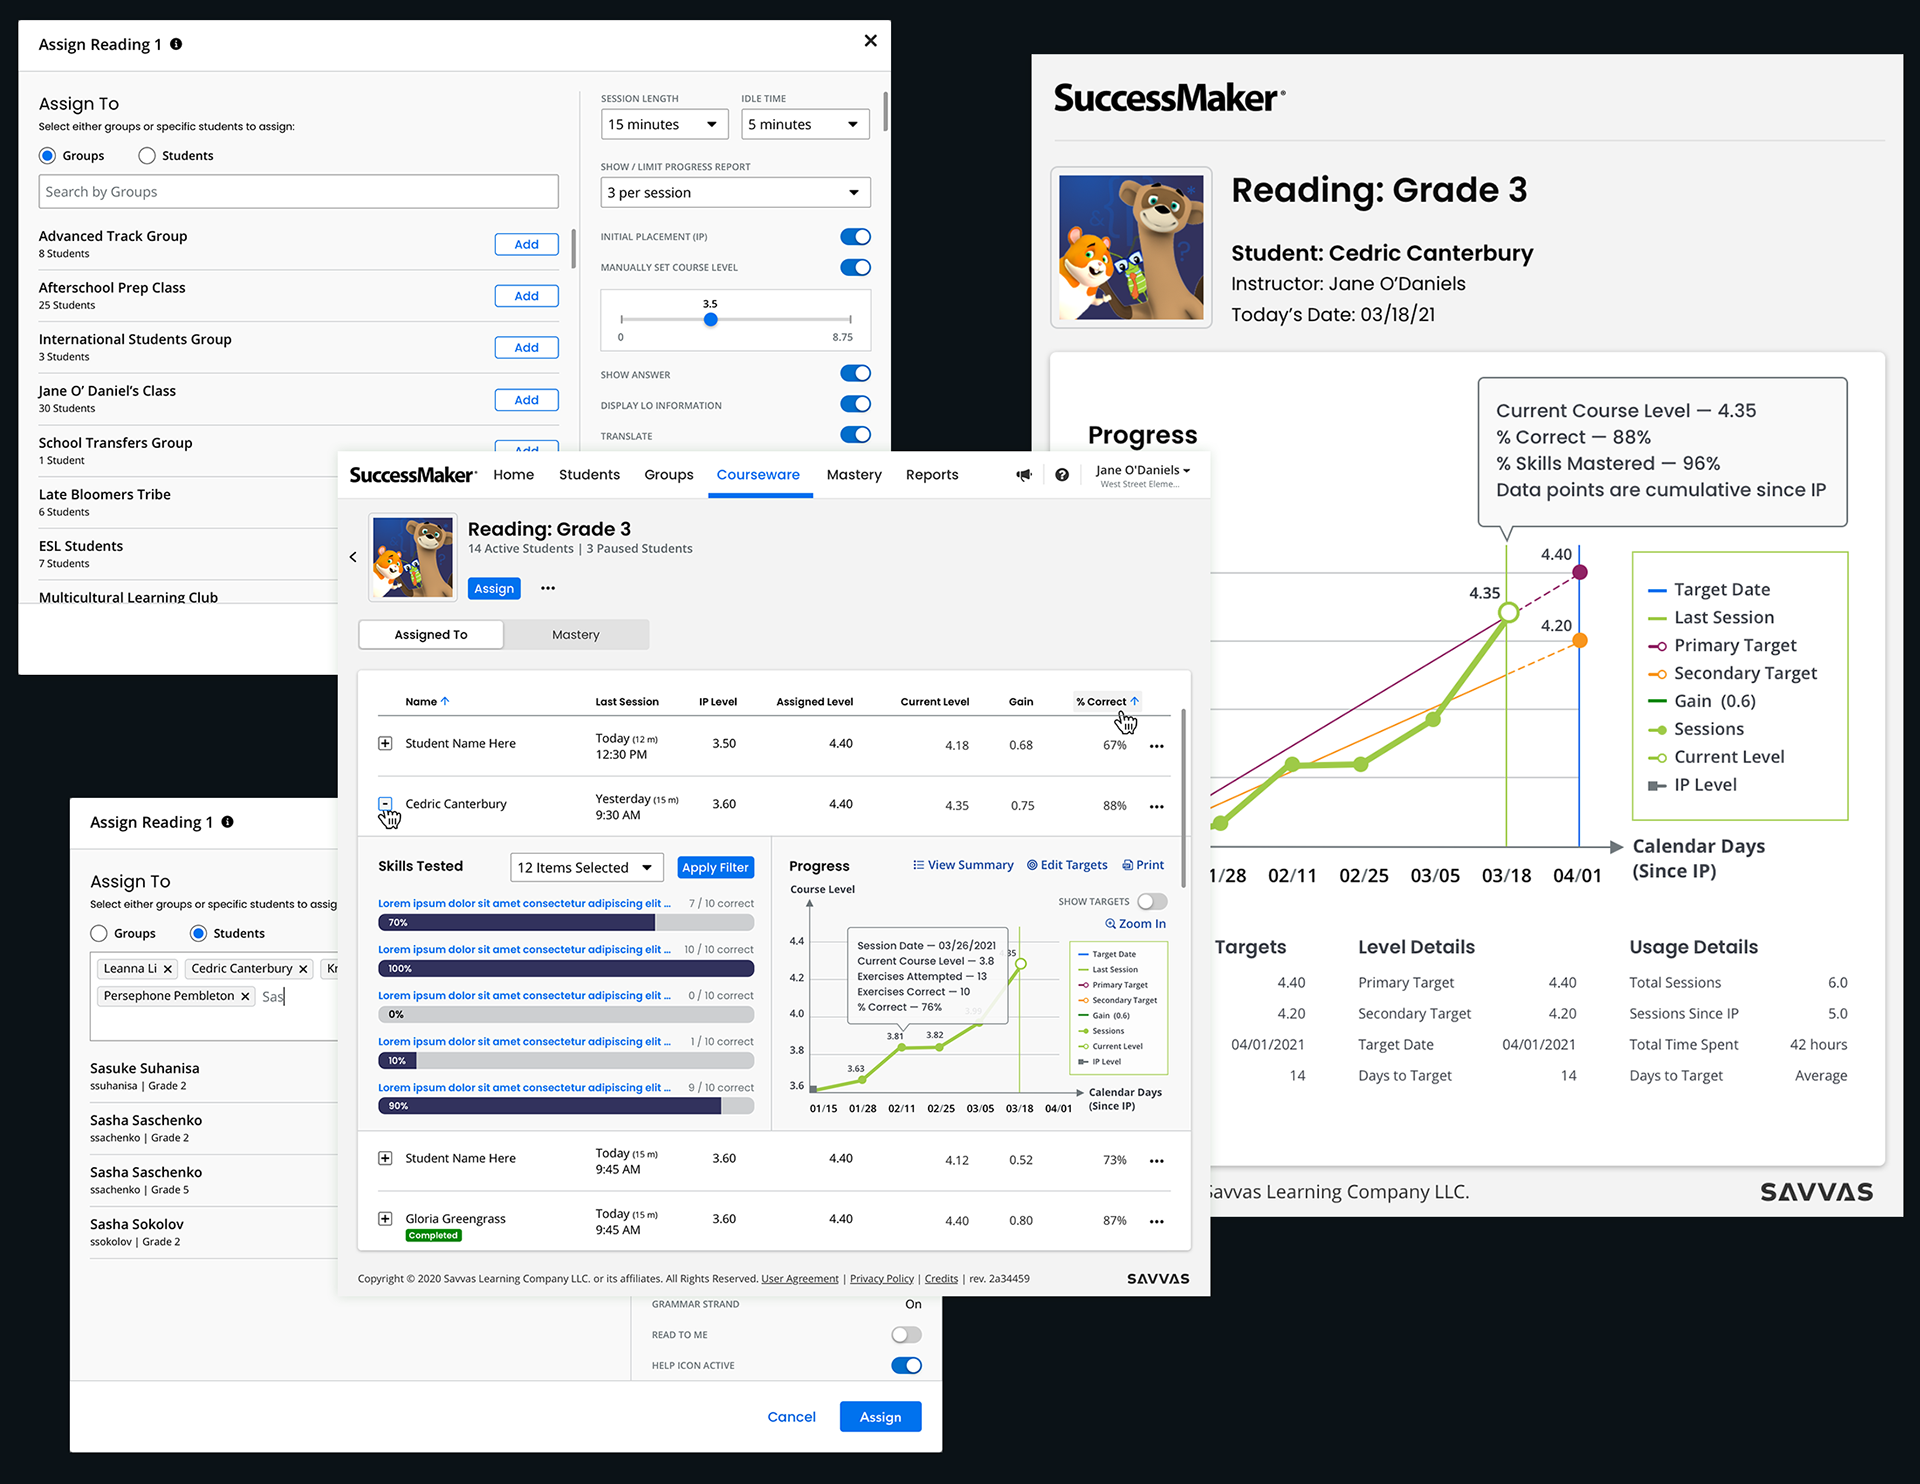
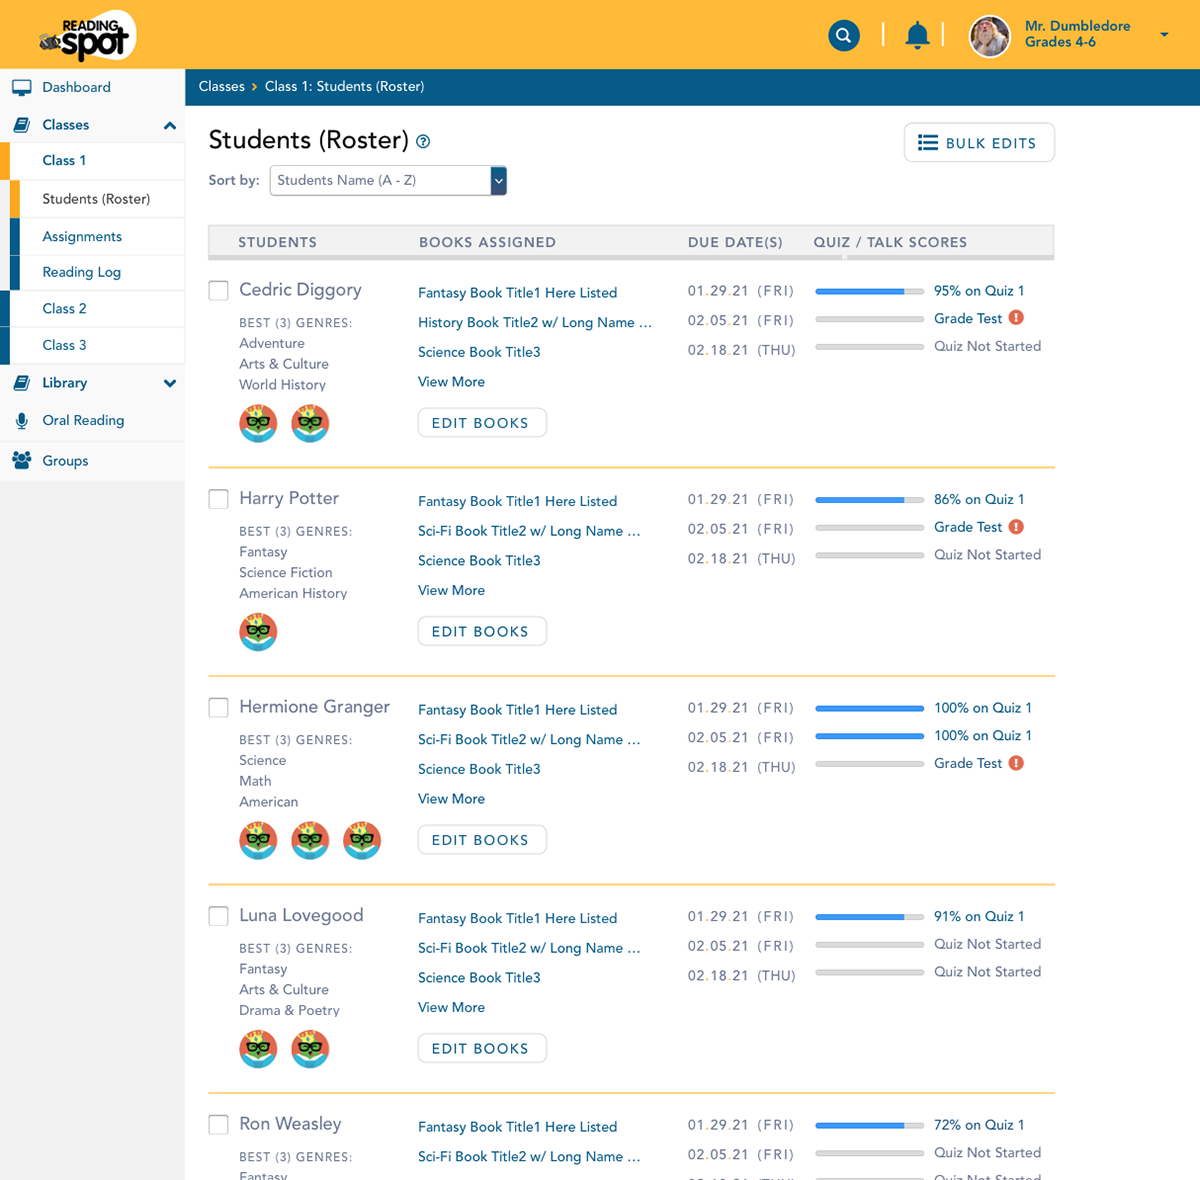
Reading Assignments + Progress Analytics
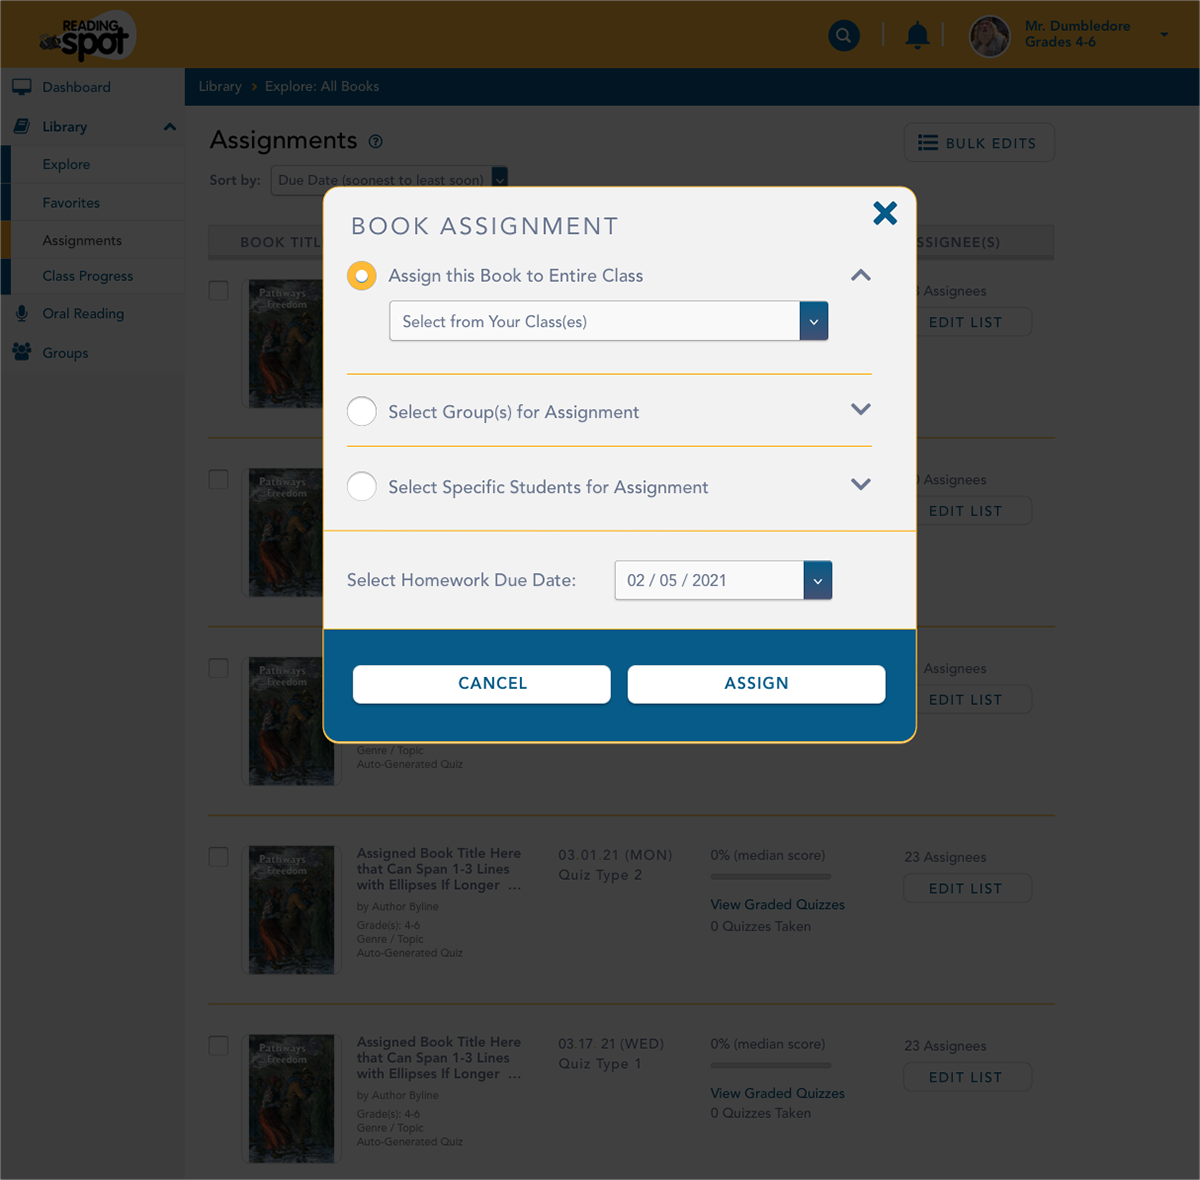
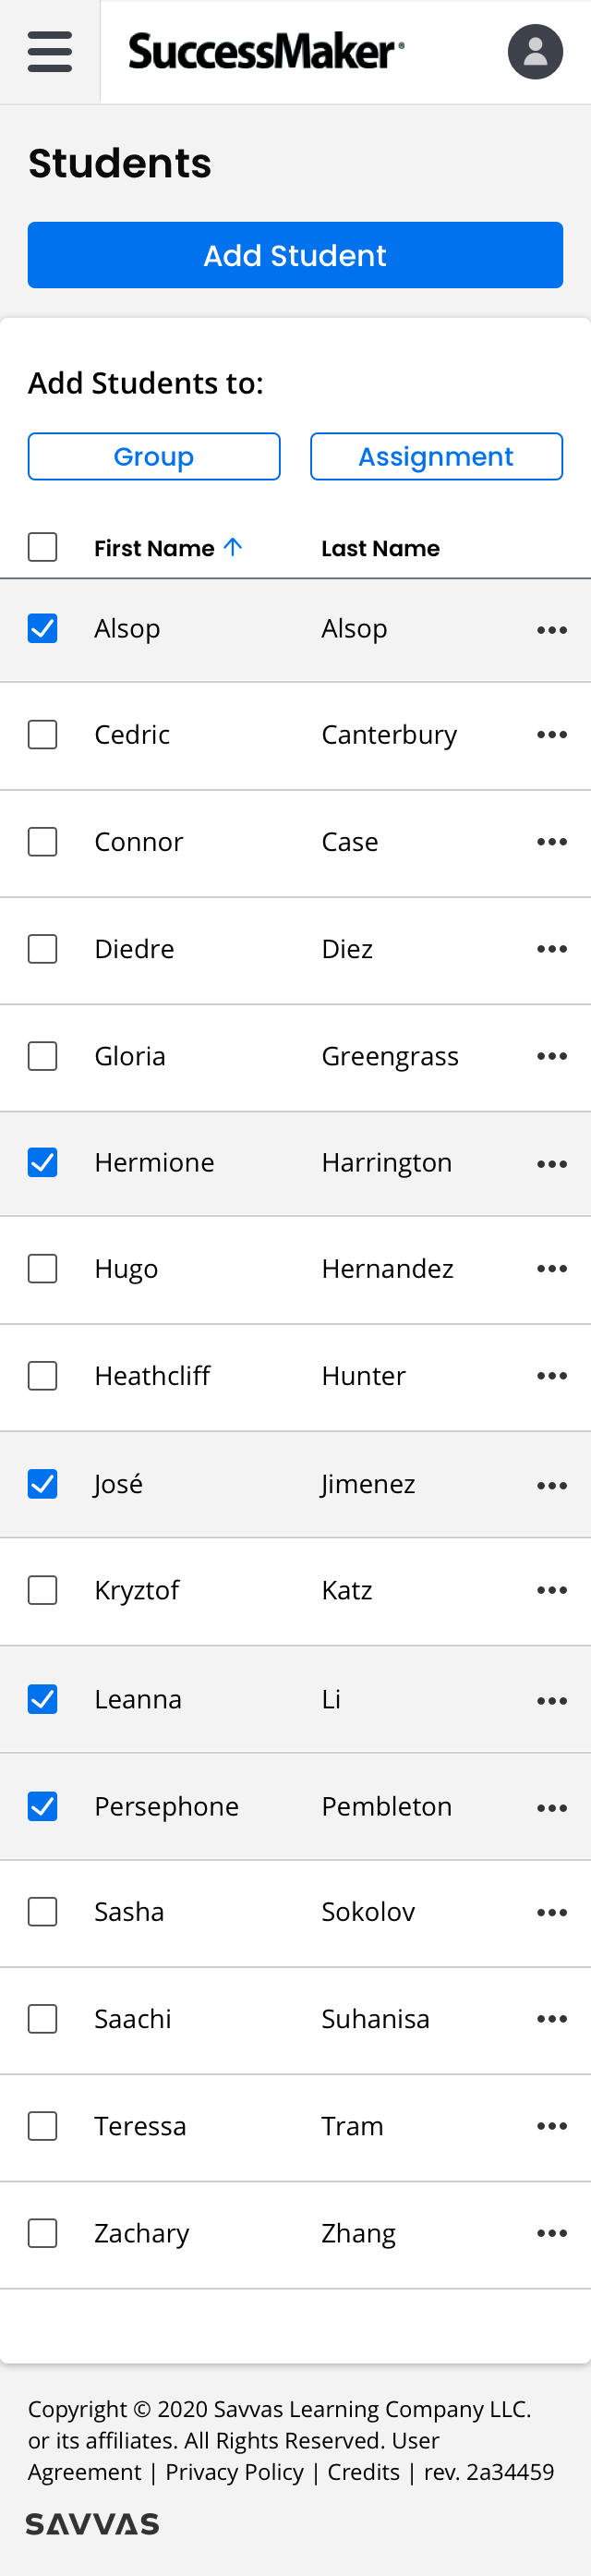
These are the desktop versions of screens that I created in Sketch illustrating features such as the ability to assign a reading or math course to specific groups or students with typeahead search capability in the tags. Course instructors can edit the settings for their courses. I proposed ways to visualize students' performance over a period of time and how that compared against their primary and second target objectives and a visualization of their evolving trajectories to meet those goals.